When a stock more than doubles in nine months, it’s worth asking what changed.
Following our look at the top three performers on the iEdge Singapore Next 50 Index – led by the semiconductor surge – we turn to the next three, which got there in very different ways.
| Metric | First Resources Limited (SGX: EB5) | Frencken Group Limited (SGX: E28) | Pan-United Corporation Ltd (SGX: P52) |
| Year-to-Date (YTD) Total Return (to September 2026) | 125.0% | 87.8% | 50.9% |
| 1H2026 Revenue Growth | +44.5% (US$973.6 million) | -0.8% (S$427.8 million) | +37.0% (S$549.6 million) |
| 1H2026 Net Profit Growth | +57.4% (US$234.9 million) | -3.4% (S$19.3 million) | +49.0% (S$30.6 million) |
| Interim Dividend (1H2026 vs 1H2025) | S$0.08(+77.8%) | None (Pays annually) | S$0.015 (+50.0%) |
Up to the end of September 2026, First Resources Limited (SGX: EB5) delivered a total return of 125%.
Frencken Group Limited (SGX: E28) came in at 87.8% and Pan-United Corporation Ltd (SGX: P52) at 50.9%.
All three figures include dividends.
Have First Resources’ earnings kept pace?
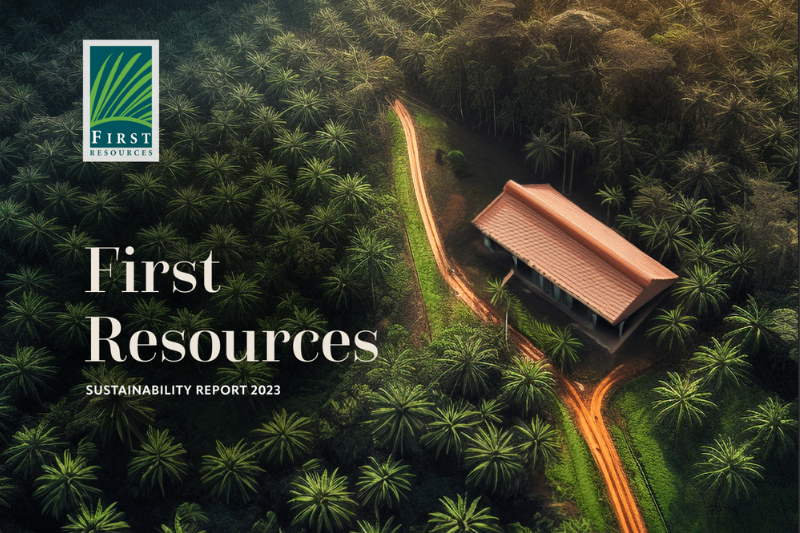
First Resources produces palm oil, mainly in Indonesia and refines it into higher-value products.
In the six months to 30 June 2026 (1H2026), revenue grew 44.5% year on year (YoY) to US$973.6 million.
Net profit attributable to owners rose even faster, climbing 57.4% to US$234.9 million, though biological asset valuations and foreign exchange gains helped lift that figure.
Strip out biological asset movements and underlying net profit grew 42.2% to US$216.2 million.
This isn’t a like-for-like comparison.
Last year’s first half included only two months of PT Austindo Nusantara Jaya, which the group bought in May 2025.
This year’s numbers include all six.
Higher sales volumes and better processing margins helped too.
Free cash flow came in at US$100.6 million, reversing an outflow of US$84.7 million from a year ago.
In tandem, the interim dividend was hiked by 77.8% to S$0.08 per share, up from S$0.045.
Investors may also have welcomed management’s view that uncertainty over Indonesia’s export rules has moderated.
None of this makes First Resources risk-free.
Export taxes, freight and interest costs all rose sharply.
Net gearing stood at 0.40x and US$115.4 million of the group’s US$229.2 million cash balance remained restricted as at 30 June 2026 under Indonesia’s revised export proceeds framework.
Management is also watching crude oil prices and developing El Niño conditions.
Why would investors pay more for Frencken when its profit fell?
Frencken builds electro-mechanical assemblies and plastic components for clients across the semiconductor, healthcare, automotive and industrial sectors.
At first glance, its 1H2026 results do not immediately look like those of an 87.8% winner.
Revenue slipped 0.8% YoY to S$427.8 million, while net profit attributable to shareholders dropped 3.4% to S$19.3 million.
A closer look at margins tells a more nuanced story.
Gross margin widened by 0.9 percentage points to 15.0% and gross profit grew 5.8% to S$64.4 million.
Here’s the thing: management expects the second-half revenue to beat both 2H2025 and 1H2026 and guides for higher full-year revenue and profit.
The group expects semiconductor, medical and automotive sales to grow.
In other words, investors appear to be paying mostly for results Frencken has promised rather than delivered.
Now Frencken has to deliver.
Free cash flow swung to an outflow of S$15.3 million from an inflow of S$50.6 million a year earlier, as working capital absorbed S$81.6 million into inventories and receivables.
Administrative and general expenses rose 9.9% and management expects industrial automation sales to fall.
Frencken does have breathing room, with net cash of S$68.8 million as at 30 June 2026.
As for the missing interim dividend, Frencken pays once a year with its full-year results, as it did last year.
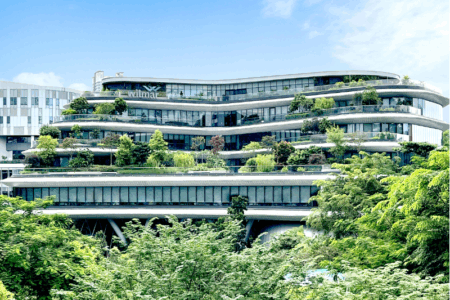
How much of the building boom has Pan-United captured?
Pan-United is Singapore’s largest supplier of ready-mix concrete, which puts it in the path of the country’s building activity.
Construction activity picked up across Singapore, Malaysia and Vietnam in the first half.
Revenue grew 37% YoY to S$549.6 million and net profit attributable to shareholders climbed 49% to S$30.6 million.
Management pointed to operating leverage and efficiencies from its AiR Digital platform.
The interim dividend also rose 50% to S$0.015 per share from S$0.010 a year ago.
For context, the Building and Construction Authority (BCA) forecasts S$47 billion to S$53 billion of construction demand for 2026.
By June, S$31 billion had been awarded, with projects including Changi Airport Terminal 5 and MRT extensions.
That pipeline may explain some of the investor interest.
On the flip side, cash flow lags profit.
Free cash flow rose to S$7.4 million from S$1.0 million, but remains well below net profit.
Trade receivables grew by S$26 million alongside revenue.
Management has also flagged energy costs and supply-chain disruptions.
As at 30 June 2026, Pan-United held net cash of S$65.2 million, excluding S$39.5 million in lease liabilities.
Get Smart: Separate what’s delivered from what’s promised
A big share price gain tells you investors have grown more optimistic.
It doesn’t tell you why.
Try sorting the evidence for each winner into two piles.
The first holds what the company has already reported in earnings and dividends.
The second holds what management expects to deliver.
First Resources and Pan-United have filled the first pile with higher profits and bigger dividends.
Frencken’s valuation re-rating, by contrast, relies heavily on execution in the second half and beyond.
A stock that rises on promises needs the company to keep them.
Before buying any of this year’s winners, ask which can still clear a higher bar after a 50%-plus run.
Some companies cut dividends in a downturn. These 5 didn’t.
Find out which Singapore blue chips have weathered past chaos…and why they could be your portfolio’s anchors in the next wave of downturn. Download the report free.
Follow us on Facebook, Instagram, Telegram and YouTube for the latest investing news and analyses!
Disclosure: The Smart Investor does not own shares in any of the stocks mentioned.