Singapore income-focused investors have long liked industrial REITs as they provide exposure to properties with long-term structural growth prospects, such as e-commerce (logistics hubs) and AI (data centres).
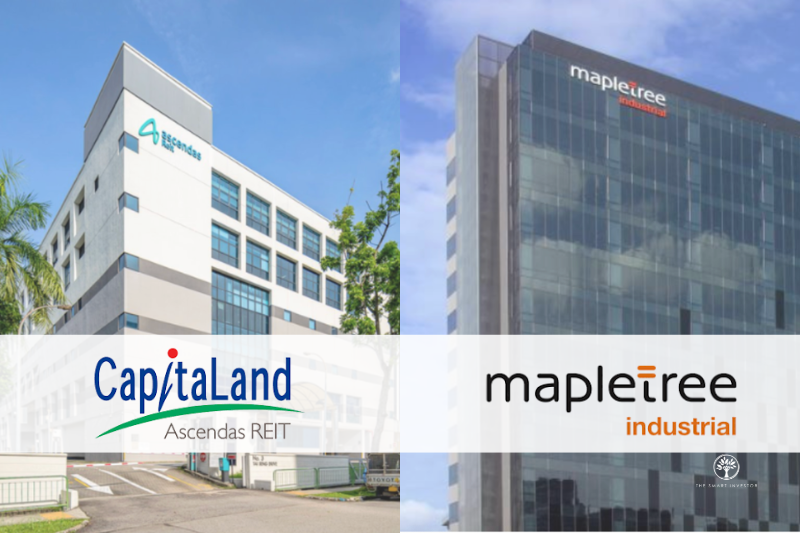
Two familiar examples are CapitaLand Ascendas REIT (SGX: A17U), or CLAR, and Mapletree Industrial Trust (SGX: ME8U), or MIT.
With an uncertain macroeconomic environment and shifts in interest rates, which REIT presents a better buy today?
Let’s find out.
Business Overview: How Do They Differ?
CLAR has a geographically diversified portfolio, with 200 properties in Singapore, Australia, Europe, and the US.
As of 31 March 2026, CLAR’s portfolio is valued at S$18.6 billion.
CLAR’s portfolio has a heavy tilt towards Singapore (67% of the portfolio’s value), with the rest of the portfolio balanced across the US, Australia and Europe.
The REIT’s properties belong to a variety of segments including business parks and life sciences (43% of overall portfolio value), logistics assets (26%), industrial assets (20%), and data centres (11%).
Overall portfolio occupancy as of 31 March 2026 is stable at 90.5%, with a weighted average lease expiry (WALE) of 3.8 years.
With a diversified tenant mix spread across 20 industries, anchored by solid blue-chips, CLAR enjoys reliable, recurring rental income.
Meanwhile, MIT’s 136 properties, which have an overall value of S$8.3 billion as of 31 March 2026, are spread across North America (46.5% of portfolio value) and Singapore (46.3%). Japan accounts for the rest.
It’s worth noting that MIT is currently pursuing accretive acquisitions in high-quality data centres across Europe and the Asia Pacific.
Unlike CLAR, data centres comprise the majority of MIT’s portfolio (53% of overall value), with the rest comprising industrial buildings, high-tech buildings, and industrial spaces.
But in a similar manner to CLAR, MIT has good occupancy at 91.2% and a healthy WALE of 4.4 years.
With a wide range of blue-chip tenants anchoring its tenant profile, MIT should also be able to collect reliable, recurring rental income from its lessees.
Financial Snapshot
Since 2021, the CLAR’s distribution per unit (DPU) has hovered around S$0.15.
The REIT’s units currently trade at S$2.52 each, translating to a trailing distribution yield of around 6%.
Net property income (NPI) rose 1.7% to S$1.1 billion in 2025.
Aggregate leverage for CLAR is manageable, with management expecting the figure to be at 37.3% in April 2026.
The interest coverage ratio is also decent at 3.5, with a cost of debt of 3.5%, and a comfortable debt maturity profile of 2.6 years.
Meanwhile, MIT’s DPU has declined from S$0.138 in FY2021/2022 to S$0.1271 in FY2025/2026.
At the current unit price of S$1.97, MIT offers a trailing distribution yield of approximately 6.5%.
MIT also has a strong balance sheet, with aggregate leverage of 37.5% and an interest coverage ratio of 4.0.
Its borrowing cost stands at 3.2%, with an average debt tenor of 3.4 years.
Growth Drivers: Where Future Upside May Come From
Future growth for CLAR will come from its productive acquisition pipeline, spanning across data centres and industrial assets.
Its more diversified exposure across logistics, industrial, and data centre assets makes the rental income earned by the REIT less reliant on a single sector.
Conversely, MIT’s bigger exposure to data centres means its growth prospects are largely linked to the secular AI and cloud computing trends.
With potentially strong rental reversions across its data centres, the REIT could see stabilisation in its NPI.
Finally, MIT’s aforementioned deliberate expansion into developed markets such as Asia Pacific and Europe could further strengthen the reliability of its rental income.
Dividend Strength: Stability vs Growth
Since 2021, CLAR has boasted a more stable DPU compared to MIT.
This could be because of the former’s diversification across multiple sectors.
Both REITs should be able to continue paying distributions, given their decent balance sheets and positive rental reversions experienced.
On maintaining distributions, CLAR might edge out MIT, given its wide diversification and the absence of specific challenges.
Key Risks Investors Should Watch
Some key risks to consider would be the potential for higher borrowing costs, which could pressure the distributions of both REITs.
For more company-specific risks, MIT has higher exposure to data centres, where a slowdown in the cloud/AI growth trends could soften its operating performance.
For CLAR, its more diversified exposure could result in slower growth compared to MIT.
Finally, both REITs face the same challenge of integrating newly acquired properties.
Valuation: Which REIT Looks More Attractive?
On a trailing twelve months (TTM) basis, MIT seems to be more attractively priced, trading at a price-to-book (P/B) ratio of 1 compared to CLAR’s 1.1.
Compared to their five-year historical average yields of 5.9% (MIT) and 5.4% (CLAR), both REITs currently trade at higher distribution yields, suggesting units remain attractively priced relative to historical norms.
Given the small discrepancy in both the P/B ratio and distribution yields, both REITs appear to be fine choices.
Get Smart: Scaling Through Diversity or Specialising for the Future
In sum, both CLAR and MIT are fine industrial REITs with long-standing track records of distribution payout and growth.
The choice of which is the better REIT to buy ultimately comes down to your preference and risk appetite.
If you’re looking for greater diversification and stability, consider CLAR for your portfolio.
However, if you’re searching for greater growth and a pure play on data centres, MIT might be suitable for you.
Imagine receiving steady rent increases for more than two decades. It sounds unusual, but one healthcare REIT already has rental escalations locked in until around 2042. Income visibility like this is hard to find today. We break down how this REIT built such dependable cash flow in our FREE dividend report and how it could strengthen a retirement portfolio. Get the free report here.
Follow us on Facebook, Instagram and Telegram for the latest investing news and analyses!
Disclosure: Wilson H. does not own shares in any of the companies mentioned.