The SPDR STI ETF (SGX: ES3), which tracks the Straits Times Index (SGX: ^STI), delivered a total return of 26.3% in the first nine months of 2026.
However, three blue chips did far better.
| Stock | 9M2026 Return (vs STI ETF) | Latest Dividend Figures | Dividend YoY Change |
| Oversea-Chinese Banking Corporation Limited (SGX: O39) | +67.9%(+41.6%) | S$0.47 per share(1H2026 interim Dividend) | +15% |
| DBS Group Holdings Ltd(SGX: D05) | +43.4%(+17.1%) | S$0.66 per share (2Q2026 interim)+ S$0.15 per share (capital return) | +10% interim |
| Yangzijiang Shipbuilding (Holdings) Ltd.(SGX: BS6) | +56.2%(+29.9%) | S$0.20 per share(FY2025 final dividend, paid May 2026) | N.A.(Pays annually) |
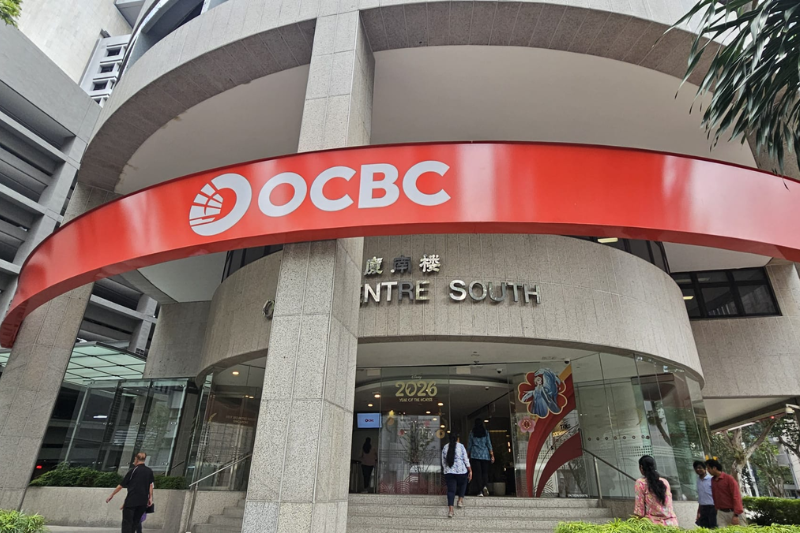
Oversea-Chinese Banking Corporation (SGX: O39), or OCBC, returned 67.9%, 41.6 percentage points ahead of the index ETF.
Yangzijiang Shipbuilding (SGX: BS6), or YZJ, and DBS Group Holdings (SGX: D05) returned 56.2% and 43.4%, beating the ETF by 29.9 and 17.1 percentage points respectively.
All figures include dividends.
What might investors have seen in these three names?
Both banks grew profits even as lending margins shrank, while YZJ ‘s profit grew on higher-priced contracts.
All three gave shareholders reason to expect more.
Why did OCBC’s profit rise when its margins fell?
OCBC felt a margin squeeze in the first half of 2026 (1H2026).
Its net interest margin (NIM) – the profit margin the bank earns on its loans – narrowed to 1.73% from 1.98% a year ago, and net interest income (NII) slipped 3% year on year (YoY) to S$4.5 billion.
Softening the blow, loan growth remained healthy, with customer loans rising 12% year on year to S$364.5 billion.
The rest of the bank more than compensated.
Non-interest income climbed 36% YoY to S$3.5 billion, supported by a 26% increase in fees and commissions to S$1.4 billion and a 46% surge in trading income to S$1.1 billion.
In addition, insurance income from Great Eastern Holdings (SGX: G07) rose 49% YoY to S$791 million.
Consequently, total income rose 11% YoY to S$8 billion.
Net profit attributable to shareholders grew 13% to a record S$4.2 billion, while the non-performing loan (NPL) ratio held steady at 0.9%.
Recognising this performance, OCBC raised its interim dividend by 15% to S$0.47 per share, up from S$0.41, while maintaining its payout ratio at 50%.
On 7 August 2026, management upgraded its FY2026 guidance, stating that it now expects high-single-digit to low-double-digit loan growth, accompanied by only a slight decline in net interest income.
Investors should keep an eye on capital levels, however.
OCBC’s common equity tier 1 (CET1) ratio fell 1.3 percentage points YoY to 15.7%.
Loan growth and the rest of its S$2.5 billion capital return programme will both draw on it.
Is DBS following the same playbook?
DBS tells a similar story.
It reports quarterly, so these figures cover the second quarter of 2026 (2Q2026) only.
Lower interest rates weighed on its margins too.
NIM narrowed 18 basis points YoY to 1.87%, dragging NII down by 2% to S$3.6 billion.
Nevertheless, customer loans still grew 8% YoY to S$469.4 billion.
Wealth management stepped in to fill the gap once again.
Wealth fees grew 42% year on year to S$919 million, lifting net fee and commission income by 25% to S$1.5 billion.
Overall non-interest income rose 21% to S$2.5 billion.
This pushed total income up by 6% YoY to S$6.1 billion, topping the S$6 billion mark for the first time.
Net profit attributable to shareholders rose 9% to S$3.1 billion, representing a return on equity of 17.9%, while its NPL ratio held firm at 1.0%.
For the quarter, DBS declared an interim dividend of S$0.66 per share and a capital return dividend of S$0.15 per share.
Like OCBC, DBS raised its full-year guidance.
It now expects 2026 total income to exceed 2025 levels and commercial book non-interest income to grow in the mid-teens.
What gives YZJ’s earnings their visibility?
YZJ grew for a different reason.
In 1H2026, revenue grew 36% YoY to RMB 17.5 billion as the shipbuilder progressively built vessels at higher contract prices.
Its new Hongyuan yard added RMB 545 million in second-quarter shipbuilding revenue.
Shipbuilding gross margin widened to 37% (from 35%), and profit attributable to equity holders grew 28% YoY to RMB 5.4 billion.
YZJ’s order book stood at US$22.4 billion as at 30 June 2026.
Where YZJ’s narrative becomes more nuanced is its cash flow.
Free cash flow rose 82% YoY to RMB 675.4 million, but that remains a small fraction of its RMB 5.4 billion profit.
Fortunately, its balance sheet offers a cushion, with RMB 15.9 billion in cash against RMB 4.1 billion of borrowings, translating to a net cash position of RMB 11.8 billion.
YZJ pays dividends once a year, so its most recent payout was a final dividend of S$0.20 per share for FY2025, paid on 14 May 2026.
Order wins remain another crucial metric to track.
YZJ secured roughly US$1.96 billion in new orders up to July 2026, about 44% of its US$4.5 billion full-year target, which management says it remains committed to.
Get Smart: Ask what profit grows through
Every business hits a headwind eventually.
When one of your stocks does, check whether profit still grows and where the growth comes from.
Then look ahead and ask what must stay true.
For OCBC and DBS, fee and wealth income need to keep growing while margins settle.
For YZJ, order wins need to keep pace with its target, and more of its profit needs to turn into cash.
Many Singapore stocks fall behind inflation, which means your money quietly loses strength over time. Dividend stocks have a very different track record. Some continued delivering 6% to 13% every year across the toughest market conditions.
In this FREE report, discover 5 crisis-tested dividend stocks that kept rewarding investors while the market struggled. Download your dividend investing guide now.
Follow us on Facebook, Instagram, Telegram and YouTube for the latest investing news and analyses!
Disclosure: The Smart Investor owns shares of OCBC and DBS.