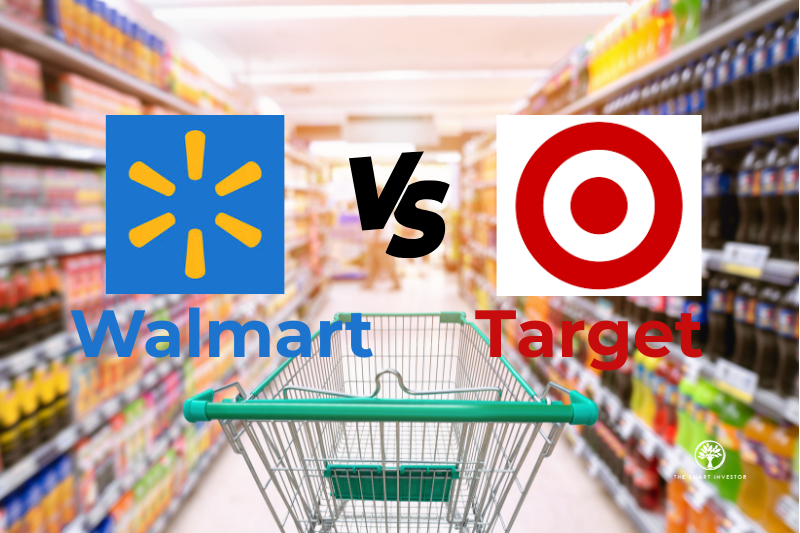
Walmart Inc. (NYSE: WMT) and Target Corp. (NYSE: TGT) are the two most recognisable retail companies in the US.
How did Walmart and Target achieve this status?
They have spent decades building trust among consumers and loyalty among investors.
The duo is also part of an elite group that has raised their dividends for more than 50 consecutive years, bestowing them with the title of “Dividend King”.
Even though they operate in the same industry, their strategies couldn’t be more different.
Different Paths to Success
Walmart’s strategy centres on providing affordability and convenience through its Everyday Low Price (EDLP) model.
The company’s hypermarket format ensures consistent low prices instead of temporary promotions.
Blending digital and physical shopping by expanding its omnichannel ecosystem through Walmart+ and digital advertising, Walmart has enhanced its position as a go-to choice for value.
With its unmatched scale and buying power, the hypermarket often acts as the price maker of the retail industry, setting benchmarks that competitors must follow.
On the other hand, Target takes a different approach.
Utilising more technology and data, Target combines fashionable merchandising with budget-friendly pricing to curate unique shopping experiences for its consumers.
Additionally, the company cultivates trust and brand affinity that keeps customers coming back through its proprietary brands and Target Circle loyalty program.
Scale vs Pricing Power
Net Sales
| FY2025 | FY2024 | FY2023 | |
| Walmart | 680.99 | 648.13 | 611.29 |
| Target | 106.56 | 107.41 | 109.12 |
* In US$ Billion
Gross Profit
| FY2025 | FY2024 | FY2023 | |
| Walmart | 162.79 | 152.50 | 142.16 |
| Target | 30.06 | 29.58 | 26.81 |
* In US$ Billion
Walmart’s fiscal year ends around 31 January and has displayed consistent growth.
The superstore operator saw a 5% year-on-year (YoY) increase in total revenue to nearly US$681 billion in FY2025.
Walmart’s disciplined cost management has allowed it to convert high scale volume into profitability, with gross profit increasing from US$147.57 billion in FY2023 to US$169.23 billion in FY2025.
Target, however, has experienced a decrease in consumer spending, especially in the non-essential categories.
Net sales have declined for two consecutive years, falling to just US$106.56 billion for the fiscal year ended 1 February 2025 (FY2025).
Yet, its gross profits rose steadily from US$26.81 billion in FY2023 to US$29.58 billion in FY2024 and US$30.06 billion in FY2025.
With improved inventory control and higher-margin sale on house brands, it has helped mitigate the weaker top-line results.
Gross Profit Margin
| FY2025 | FY2024 | FY2023 | |
| Walmart | 24.85 | 24.38 | 24.14 |
| Target | 28.21 | 27.54 | 24.57 |
* In %
Although Walmart generated six times of Target’s sales, Target generally earns more gross profit per dollar in revenue.
Due to its broader range of discretionary and general merchandise, Target’s gross profit margin averaged around 27% over the three years, compared to Walmart’s 24.4%.
Beyond the Checkout Lanes
Operating Cash Flow
| FY2025 | FY2024 | FY2023 | |
| Walmart | 36.44 | 35.73 | 28.84 |
| Target | 7.37 | 8.62 | 4.02 |
* In US$ Billion
Free Cash Flow (FCF)
| FY2025 | FY2024 | FY2023 | |
| Walmart | 12.66 | 15.12 | 11.98 |
| Target | 4.48 | 3.82 | -1.51 |
* In US$ Billion
Walmart’s operational discipline also drove operating cash flow to US$36.44 billion in FY2025, up from US$35.73 billion in FY2024.
Free cash flow (FCF) also saw a strong jump in FY2024, rising 26.2% YoY to US$15.12 billion.
FCF then moderated to US$12.66 billion in FY2025 as the company increased capital spending to support long-term investments.
Rather than a financial strain, this is a sign of continued reinvestment.
With continued investment into its omnichannel ecosystem, Walmart is expected to maintain steady growth in the years ahead.
As for Target, its numbers tell a different story.
Operating income fell 14.5% YoY to US$7.37 billion for FY2025 despite a strong recovery in FY2024.
Even so, the retailer was still able to continuously improve its FCF.
After reporting a negative US$1.51 billion in FY2023, FCF rebounded to a positive US$3.82 billion in FY2024 and climbed further to US$4.48 billion in FY2025.
Free Cash Flow Margin
| FY2025 | FY2024 | FY2023 | |
| Walmart | 1.88 | 2.35 | 1.98 |
| Target | 4.20 | 3.55 | -1.38 |
* %
The improvement in FCF is also reflected in Target’s margin performance.
The retailer’s FCF margin increased to 4.2% in FY2025, compared to Walmart’s 2%, indicating Target’s ability to convert a higher portion of its revenue to free cash.
However, Target’s negative margin in FY2023 (-1.38%) suggests weaker consistency in cash generation.
To its credit, Target has been tightening inventory control and improving its merchandising strategy.
If discretionary spending recovers, these initiatives would definitely aid in its gradual recovery.
Dividend Sustainability
Total Dividend Per Share
| FY2025 | FY2024 | FY2023 | |
| Walmart | 0.83 | 0.76 | 0.75 |
| Target | 4.44 | 4.36 | 3.96 |
* In US$
Both discount-box retailers proudly hold their places among the Dividend Aristocrats with their continuously increasing dividends.
Walmart has raised its dividends for 52 years straight, from US$0.75 per share in FY2023 to US$0.83 in FY2025.
Target’s record is just as impressive.
Its dividends climbed from US$3.96 to US$4.44 per share over the same period.
This constant dividend growth demonstrates their dedication to returning value to their shareholders.
Get Smart: Stability or Upside
The two retail giants are pillars of the US retail industry that address consumer needs with their own unique strategies.
With its large scale and price leadership, Walmart remains as a strong long-term hold, especially for those who seek dependable income.
For those who want dividend growth with an upside potential, Target may be the better option.
In either case, both superstores offer dependability and unwavering commitment to their shareholders.
Generative AI is reshaping the stock market, but not in the way most investors think. It’s not just about which companies are using AI. It’s about how they’re using it to unlock new revenue, dominate their markets, and quietly reshape the business world. Our latest FREE report “How GenAI is Reshaping the Stock Market” breaks the hype down, so you can invest with greater clarity and confidence. Click here to download your copy today.
Follow us on Facebook, Instagram and Telegram for the latest investing news and analyses!
Disclosure: Charlyn T. owns shares of Walmart.