Most real estate investment trust (REIT) investors read results the same way.
They find the distribution per unit (DPU), check whether it went up and move on.
That habit can mislead.
Three Singapore REITs report later this month, and each gave investors a reason to read past the headline last time.
Frasers Centrepoint Trust (SGX: J69U), or FCT, and Suntec REIT (SGX: T82U) report on 22 October 2026.
CapitaLand China Trust (SGX: AU8U), or CLCT, follows on 23 October.
What will FCT’s first financial figures since the half-year reveal?
FCT is the largest owner of suburban retail space in Singapore.
It owns nine malls and one office property, with assets under management (AUM) of S$8.4 billion.
The manager reports financial figures only at the half-year and full-year marks.
Its business update for the third quarter of FY2026, released on 27 July 2026, carried no net property income (NPI) or DPU.
Retail committed occupancy stood at 99.6% as at 30 June 2026, down from 99.8% three months earlier.
The latest figure excluded Hougang Mall and NEX, both undergoing asset enhancement initiatives (AEIs).
The Hougang Mall AEI was over 98% committed and on track for completion in September 2026, while NEX’s Phase 1 had reached 87% pre-commitment.
Watch how occupancy moves once these malls return to the count.
Shopper traffic rose 2.4% year on year (YoY) in the quarter.
Tenancy churn and refresh held tenants’ sales growth to 0.2%.
FCT did not disclose rental reversion, so look for that figure in the full-year release.
Aggregate leverage stood at 40.4%.
The average cost of debt fell to 3.0% from 3.2% in the preceding quarter.
FCT also proposed to divest White Sands for S$467.0 million, an 8.4% premium to valuation.
The manager earmarked net proceeds of S$454.1 million for debt repayment, which would lower pro forma leverage to 36.5%.
On the flip side, FCT would give up White Sands’ rental income.
Investors should weigh the interest saved against the income lost.
FCT has a 50% interest in the commercial component of a consortium bid for the Bayshore Drive site at a tender price of S$2.1 billion.
Any funding details will shape where leverage goes next.
Can Suntec REIT’s DPU growth outlast its one-offs?
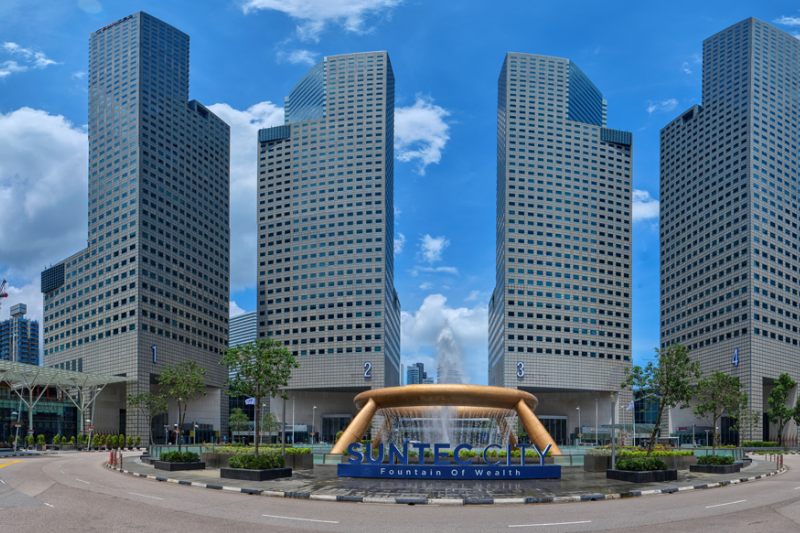
Suntec REIT is Singapore’s first composite REIT and owns 10 properties across Singapore, Australia and the UK, with AUM of S$12.2 billion.
For the first half of 2026 (1H2026), DPU rose 24.8% YoY to S$0.039.
Gross revenue grew 1.9% to S$238.9 million, but NPI slipped 0.3% to S$159.0 million.
In other words, DPU grew far faster than property income.
The manager credited stronger Singapore office and retail performance.
A S$9.4 million reduction in financing costs also helped, as did the absence of a S$3.4 million Australian withholding tax provision.
That last item reflects a prior-year comparison, not an operational gain.
Committed occupancy for both Singapore office and retail stood at 99.5% as at 30 June 2026.
Rental reversion came in at 10.1% for office and 10.7% for retail.
Aggregate leverage rose to 43.0%, the highest of the three REITs here.
On 22 October, check whether NPI returns to growth and whether Singapore reversions stay positive.
If the release includes DPU, compare its growth with NPI before reading too much into it.
When will CLCT’s same-store gains show up in the headline?
CLCT is the largest China-focused Singapore REIT.
It owns 17 properties in China across retail malls, business parks and logistics parks, with AUM of S$4.6 billion.
Its 1H2026 headline numbers looked weak.
Gross revenue fell 5.2% YoY to RMB822.6 million.
NPI declined 3.3% to RMB561.0 million and DPU slipped 1.6% to S$0.0245.
Exclude CapitaMall Yuhuating, which CLCT divested in October 2025, and the picture improves.
On that same-store basis, revenue eased only 0.2%.
NPI grew 1.3% and DPU rose 2.9%.
The Yuhuating drag should fade once YoY comparisons move past the divestment.
Business parks remain the weak spot.
Committed occupancy fell to 85.1% from 86.9% a year ago, with rental reversion at -12.0%.
Retail reversion stood at -2.7%, though retail occupancy improved to 97.3% from 96.9%.
Logistics shows the most encouraging trend.
Occupancy rose to 99.0% from 96.6%.
Reversion improved to -1.2% in 1H2026 from -24.5% for the full FY2025.
The periods differ, but a move into positive territory would be worth noting.
CLCT also saved 16% on interest YoY.
Aggregate leverage improved to 40.4% from 42.1%, with the average cost of debt at 3.06%.
A higher realised foreign exchange loss offset part of these gains, so watch the currency line on 23 October.
Get Smart: Find what filled the gap
DPU tells you what unitholders received.
NPI tells you what the properties earned.
When the two move apart, find out why before deciding whether the trend will last.
When these three REITs report, put the DPU change next to the NPI change.
If the gap is wide, look for the bridge.
Interest savings and one-off items can lift DPU growth above NPI growth for a while.
Then, ask the really important question: ask whether that bridge will still be there next year.
If you want to retire with a constant stream of dividends, these 5 stocks might be all you need. We’ve found 5 SG stocks that have kept paying (and growing) through inflation, rate hikes, and recessions. See what they are with our latest free report for SGX dividend investors. Click here to get instant access.
Follow us on Facebook, Instagram, Telegram and YouTube for the latest investing news and analyses!
Disclosure: The Smart Investor owns units of FCT.