Industrial REITs have proven their mettle in the last 18 months.
Many have held up well compared to other REIT sub-classes, with rental income continuing to flow in amid high occupancy rates.
If you are looking for a strong industrial REIT that provides a resilient stream of dividend income, you will be spoilt for choice.
With this in mind, we decided to compare two of these REITs — Mapletree Logistics Trust (SGX: M44U), or MLT, and Mapletree Industrial Trust (SGX: ME8U), or MIT.
Both REITs have the same reputable sponsor, Mapletree Investments Pte Ltd, and have portfolios that contain industrial properties.
Let’s compare these two high-quality REITs to see which will make a better investment choice.
Portfolio characteristics
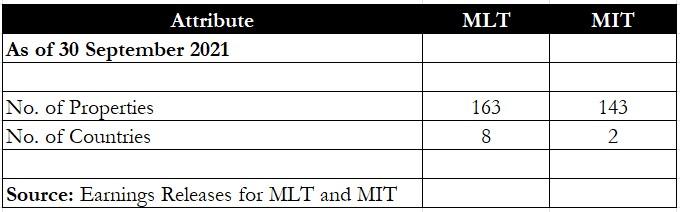
First off, we compare the portfolio characteristics for both REITs.
MLT’s portfolio comprises 163 properties spread out across eight countries, namely Singapore, Hong Kong and China, Japan, Australia, South Korea, Malaysia, Vietnam, and India.
Its total assets under management (AUM) stands at S$10.8 billion as of 30 September 2021.
In contrast, MIT’s portfolio is concentrated in just two main countries — Singapore and the US.
MIT owns 143 properties with an AUM of S$8.5 billion.
One hallmark of a resilient REIT is one that owns a diversified portfolio of properties to mitigate the risk of any country facing economic stress.
Having a diverse mix of countries and regions also helps to capture growth opportunities within each territory.
Winner: MLT
Financial metrics
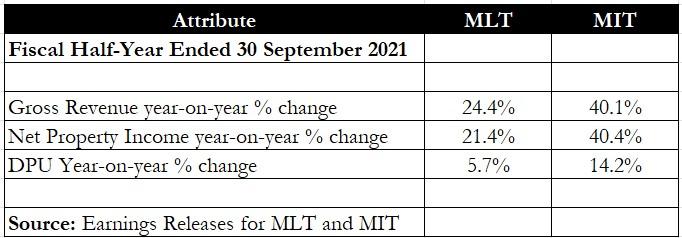
Financials-wise, both REITs enjoyed double-digit year on year increases in gross revenue and net property income (NPI).
MIT’s 40% year on year surge in revenue and NPI was mainly attributed to the acquisition of 29 data centres in the US.
The acquisition helped to bump up the REIT’s AUM from S$6.7 billion three months ago to its current level.
Data centres also account for slightly more than half of its total AUM.
For MLT, higher revenue from existing properties coupled with acquisitions helped to boost revenue and NPI.
MIT improved its distribution per unit (DPU) by 14.2% year on year but MLT’s DPU only inched up by 5.7% year on year due to an enlarged unit base from its equity fundraising.
Winner: MIT
Leverage and cost of debt
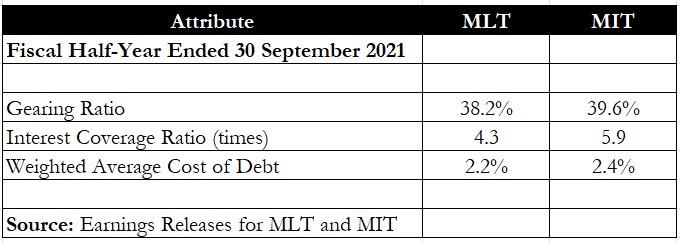
Next, we turn to each REIT’s gearing.
Both MIT and MLT’s gearing ratios were roughly the same at 39.6% and 38.2%, respectively.
However, MIT had a higher interest coverage ratio (ICR) of 5.9 times compared to MLT’s 4.3 times.
MLT’s cost of debt was slightly lower than MIT’s at 2.2% versus 2.4%.
With both REITs having roughly similar levels of gearing and cost of debt, the more important attribute to look for is the ICR as it hints at the ability of the REIT to service its loans.
Winner: MIT
Operating metrics
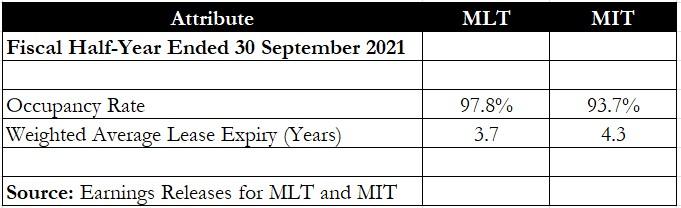
MLT’s portfolio enjoyed an occupancy rate of 97.8%, more than four percentage points more than MIT.
MIT’s lower occupancy rate was due to the completion of the data centre acquisitions as these properties only had an average occupancy rate of 87.8%.
However, MIT has a slightly longer weighted average lease expiry (WALE) of 4.3 years as its data centre portfolio acquisition had a WALE of 7.6 years.
Although WALE does signify the stability of a REIT’s rental income, the more immediate concern is the occupancy rate as it will determine the level of rental income the REIT enjoys.
In turn, it will impact the REIT’s ability to maintain its DPU.
Winner: MLT
Dividend yield
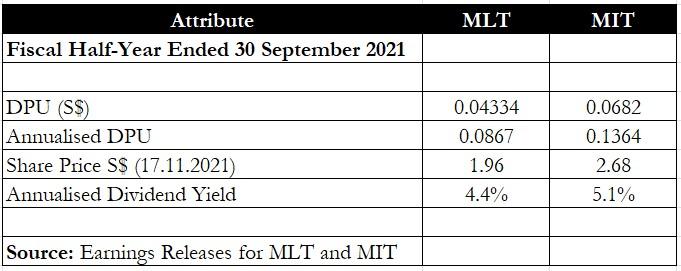
For yield-focused investors, this section will probably be the clincher for them.
We compared both REITs’ fiscal first half DPU and annualised them to obtain the annualised dividend yield.
From the table, it’s clear that MIT has a higher yield of 5.1% compared to MLT.
Winner: MIT
Get Smart: Portfolio composition and prospects
Aside from the attributes above, investors should also look at two more factors — each REIT’s portfolio composition and its prospects.
MIT’s portfolio of properties is spread out across different kinds of industrial buildings ranging from data centres and business parks to flatted factories and hi-tech buildings.
MLT, on the other hand, is focused on just the logistics sector.
MIT’s portfolio is also geared towards data centres as the REIT manager has made several acquisitions in this space in the last 12 months.
MLT has historically been more acquisitive with an average of four to six acquisitions per calendar year, on average.
MIT, on the other hand, makes fewer but larger acquisitions with an average of one or two acquisitions per calendar year.
Although both REITs have their merits as logistics and data centres are both fast-growing sectors, I will stick with MIT for now as it has both a higher dividend yield and has managed to grow its DPU more quickly.
With their enormous potential for gains and sustainability, no other sectors can beat these 2 trends in 2022. If you’re a growth investor, jumping early into these industries means you’ll never have to worry about running out of stock ideas. Our investing team has prepared a FREE webinar, where they will dive deep into 2 hot trends for 2022. Click HERE to register for free now.
Follow us on Facebook and Telegram for the latest investing news and analyses!
Disclaimer: Royston Yang owns shares of Mapletree Industrial Trust.