Three blue-chip stocks on the Singapore Exchange (SGX) are trading at or near their 52-week highs.
Each one got there for different reasons.
And each faces a different set of risks from here.
Has SGX earned the right to trade at these levels?
Singapore Exchange (SGX: S68) just delivered its strongest-ever half-year performance for the first half of fiscal year 2026 (1HFY2026).
Net revenue rose 7.6% year on year (YoY) to S$695.4 million.
Operating profit climbed 10.8% to S$424.6 million.
The Equities-Cash division did the heavy lifting, with net revenue surging 16.2% YoY to S$223.9 million – now the group’s largest division at 32.2% of total net revenue.
Securities daily average traded value (SDAV) climbed 19.5% to S$1.5 billion, and Singapore’s total market capitalisation crossed the S$1 trillion mark for the first time.
IPO activity has also turned a corner.
SGX recorded 15 new equity listings that raised S$3 billion in 1HFY2026. A year ago? Five listings raising a mere S$19.7 million.
On dividends, management has delivered on its commitment to raise the quarterly payout by S$0.0025 every quarter from FY2026 through FY2028.
If this trajectory holds, the FY2026 annual dividend would come in at S$0.445 – an 18.7% jump from FY2025’s S$0.375.
The weak spot was Equity Derivatives, where net revenue fell 5.6% to S$167.4 million.
Weakness in GIFT Nifty 50, FTSE Taiwan, MSCI Singapore, and Nikkei 225 futures dragged volumes lower.
Whether this segment can recover in the second half is worth watching.
The dividend step-up commitment also depends on earnings growth.
A S$15 million goodwill impairment on Scientific Beta held back net profit, which rose by just 0.8% YoY.
The adjusted payout ratio of about 65% still leaves headroom – but the margin for error is thinner than the headline suggests.
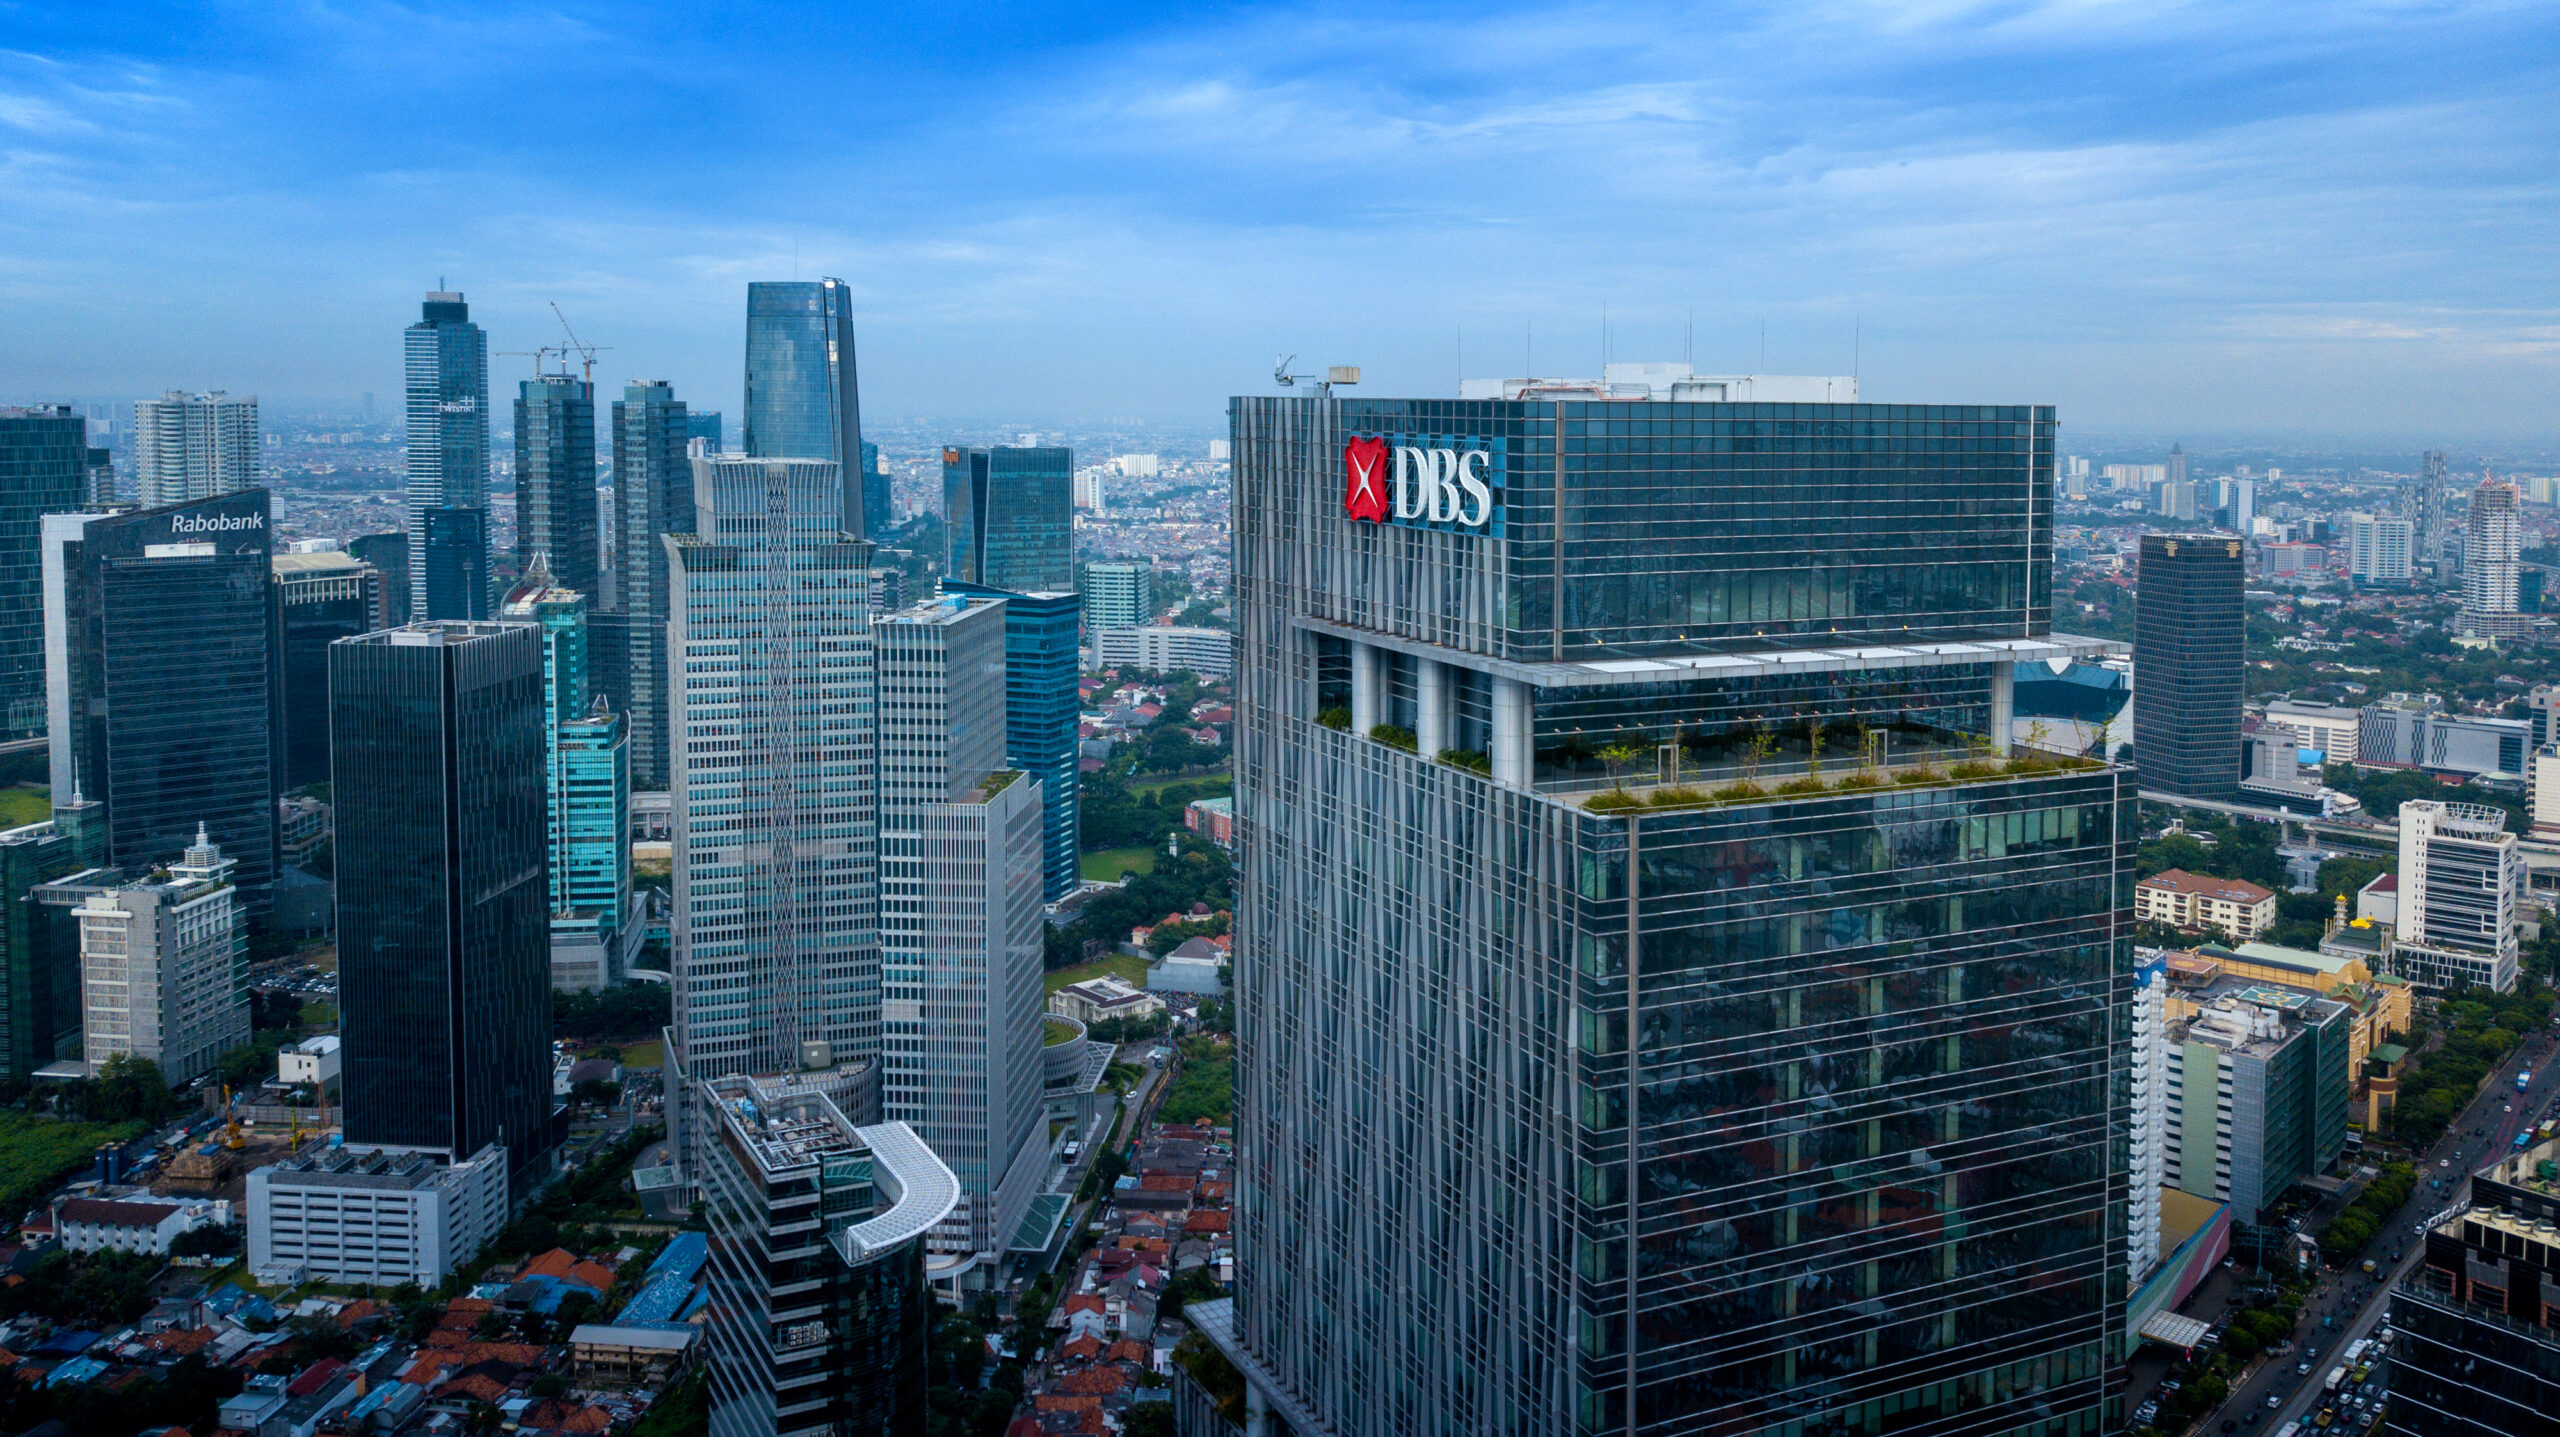
What’s keeping DBS near its high?
DBS Group (SGX: D05) posted a record total income of S$5.95 billion in 1Q2026.
That’s the good news.
The less obvious story is the shift happening underneath.
Net interest margin (NIM) has now compressed for five consecutive quarters to 1.89%.
SORA was halved from 2.54% a year ago to 1.07%, dragging net interest income (NII) down 5% YoY to around S$3.5 billion.
Wealth management has picked up the slack.
The segment hit a record S$1.59 billion in income, with assets under management (AUM) reaching S$492 billion – up 17% YoY in constant currency terms.
Non-interest income as a whole grew 11% to S$2.45 billion.
Customer deposits also grew 12% YoY to around S$630 billion, with more than two-thirds of the increase coming from CASA balances.
Now, the dividend.
The 1Q2026 payout of S$0.81 per share comprised S$0.66 of ordinary dividend and S$0.15 of Capital Return dividend, bringing the annualised figure to S$3.24 per share.
Here’s the catch.
The Capital Return programme is only committed through 2027.
That means S$0.60 of the S$3.24 annualised dividend has an expiry date.
And the CEO declined to commit to the next ordinary dividend step-up, citing geopolitical uncertainty from the Iran war.
The durability of DBS’s dividend trajectory hinges on a smooth handover from Capital Return to ordinary dividend growth.
That handover is not yet assured.
On asset quality, specific allowances fell to just 0.14% of loans in 1Q2026, well below the guided range of 0.17% to 0.2%.
The general allowance overlay stands at S$2.4 billion.
Whether that buffer gets tested depends on how the Iran war’s second-order effects play out.
Is FLCT’s DPU decline as bad as it looks?
Frasers Logistics and Commercial Trust (SGX: BUOU), or FLCT, sits about 7% below its 52-week high.
Of the three stocks here, it has the most complicated story to tell.
Total DPU declined 1.7% YoY to S$0.0295.
That’s the headline.
But strip out divestment gains, and underlying DPU actually rose 11.9%, from S$0.0252 to S$0.0282.
The decline was driven almost entirely by lower one-off divestment gains (S$5 million versus S$18 million a year ago), not by any deterioration in the core business.
The balance sheet has also turned a corner.
Finance costs rose just 0.7% YoY – a far cry from the 35% surge that weighed on 1HFY2025.
Aggregate leverage dropped to 33.7% from 36.1%, restoring S$727 million of debt headroom before the 40% gearing level.
Net property income grew 3.6% to S$167 million.
Portfolio occupancy stood at 96.1%, up from 93.9% a year ago.
The logistics and industrial segment remains rock-solid at 99.8%.
The question marks sit squarely on FLCT’s commercial properties.
Alexandra Technopark’s occupancy improved to 85.6% from 77.1%, with about 83% of ex-Google space now leased and new tenants expected by January 2027.
But no additional space was backfilled in the latest quarter – leasing momentum has stalled.
More concerning, Maxis Business Park in the UK saw occupancy fall sharply from 91.4% to 82.8% quarter on quarter.
The UK and Australia account for 56.8% of FLCT’s portfolio value, and occupancy for the commercial assets across both markets has been underwhelming.
FLCT is building a more sustainable DPU base, but it will take more than one quarter to prove that the improvement is here to stay.
Get Smart: Should you worry when a stock is near its high?
A stock near its 52-week high tells you one thing: the market has rewarded its recent performance.
It doesn’t tell you what happens next.
For that, you need to look at the drivers.
SGX has structural catalysts in the IPO revival, EMRG recommendations, and a locked-in dividend step-up.
DBS faces a dividend handover question as Capital Return winds down.
And FLCT needs its commercial properties to close the gap with its logistics portfolio.
The stock price is the scoreboard.
The drivers are the game.
What are the stock secrets to Singapore’s “quiet millionaires?” Chances are, you’ll find at least one of their favourites in this free report. Download it now and see how these stocks could power your portfolio!
Follow us on Facebook, Instagram and Telegram for the latest investing news and analyses!
Disclosure: Calvina L. owns shares of DBS and SGX.