Over the past decade, ST Engineering (SGX: S63) has expanded across commercial aerospace (CA), defence and public security (DPS), and urban solutions (USS).
Its top line, earnings and its order book have surged, leading to a dramatic surge in its share price and market value.
Let’s find out why.
ST Engineering 10 Years Ago vs Today – How Much Has the Business Changed?
| Metric | FY2015 | FY2025 | Change |
| Revenue | S$6.3 billion | S$12.3 billion | 95.2% |
| Net profit | S$529 million | S$850.8 million | 60.8% |
| EBITDA | S$697.6 million | S$1.8 billion | 154% |
| Free cash flow | -S$12 million | S$1.2 billion | N.M. |
| Order book | S$11.7 billion | S$33.2 billion | 183.8% |
| Dividend per share | S$0.15 | S$0.23 | 53.3% |
| Share price (4 September) | S$2.92 | S$10.48 | 258.9% |
| Market capitalisation (4 September) | ~S$10 billion | ~S$32.5 billion | ~225% |
*Note: FY2025 figures for net profit, EBITDA, and free cash flow are on a base operating performance (BOP) basis, which strips out one-off impairment losses of S$689 million and divestment gains of S$301 million. BOP better reflects the underlying business. Reported net profit for FY2025 was S$463 million.
The First Decade-Long Driver: Aerospace
A decade ago, CA was mostly a regional MRO (maintenance, repair and overhaul) shop.
It now converts passenger jets into freighters and builds engines and components for a global base.
The logic is structural: aircraft need maintenance regardless of who built them, and a growing global fleet gives MRO providers a long runway.
The top line more than doubled, from S$2.1 billion to S$5.0 billion – a 138% rise.
BOP operating profit rose to S$487 million, and BOP margins held steady at about 9.8%.
The segment’s order book stood at S$5.8 billion as of 31 December 2025 — ST Engineering didn’t break this out by segment back in 2015, so there’s no comparison point.
The Second Driver: Defence and Public Security
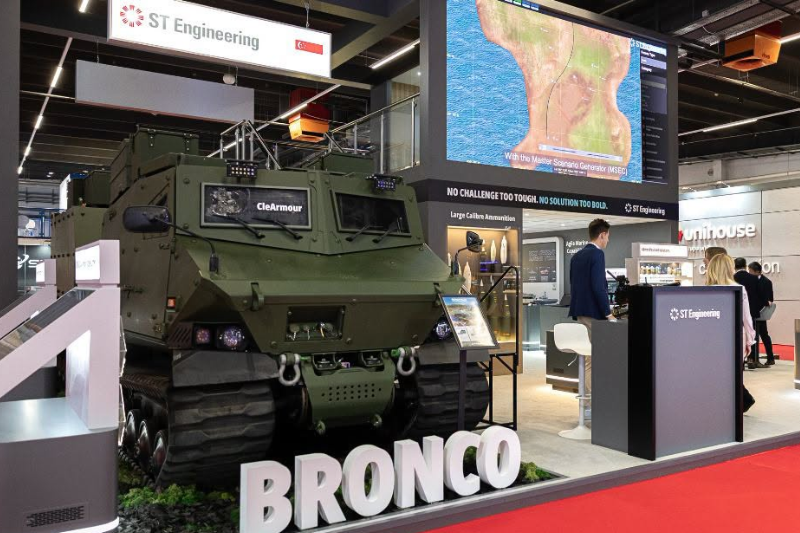
DPS — defence systems, communications, land systems and public safety — has grown alongside rising global defence spending, generally under long-duration contracts that provide real revenue visibility.
Defence spending tends to follow long-term strategic planning, and combined with recurring maintenance work, this gives the segment a steadier earnings base.
The Third Driver: A Much Larger Order Book
Group-wide, the order book has nearly tripled to S$33.2 billion from S$11.7 billion, outpacing revenue growth.
That’s not the same as more profit, though – contract margins, execution quality and delivery timelines all still matter.
What matters is whether this order book gets converted to tangible cash.
The Fourth Driver: Acquisitions and Portfolio Expansion
ST Engineering made some acquisitions over the years, and each one filled a specific capability gap. Aethon, bought in 2017, brought robotics that later seeded the USS.
MRA Systems (MRAS) followed in 2019, pushing Aerospace from MRO work into OEM-level nacelle manufacturing, and Newtec and Glowlink in 2019 gave the group real scale in satcom.
Then came TransCore in 2021/22 – the one that turned ST Engineering into a North American tolling leader and the single biggest driver of USS’ growth since then.
Profit Growth: Did the Bottom Line Keep Up?
Net profit grew only 4.9% a year, and EPS rose 4.8%.
Gross margin fell from 20.2% to 17.5%.
Operating margin dropped from 8.1% to 6.8%.
Net margin slid from 8.4% to 6.9%.
However you measure it, the business earns less per dollar of revenue than it did ten years ago.
Free Cash Flow: Is the Growth Real?
Cash tells a better story.
Operating cash flow (OCF) climbed to S$1.71 billion from S$465.5 million, while capex barely moved (S$477 million to S$506 million) – so free cash flow (FCF) swung from a deficit of S$12 million to S$1.2 billion.
FCF as a share of net profit now stands at 141%, and cumulative FCF over the decade reached S$6.7 billion – the one place the group has unambiguously improved.
The Dividend Story – How Has ST Engineering Rewarded Shareholders?
Dividend per share grew from S$0.15 to S$0.23 – up 53.3% cumulatively (4.4% CAGR), real growth, but far slower than revenue, profit, FCF, and especially the share price.
On a BOP basis, the payout ratio dipped from 88% to 84% of EPS.
On a reported basis, however, the S$0.23 dividend exceeded the reported EPS of S$0.1484 – a reminder that 2025’s one-off charges depressed reported earnings well below the underlying run rate.
Dividend yield, meanwhile, fell hard, from 5.1% in 2015 to 2.2% today, purely because the share price ran up faster than the payout did.
A decade-ago buyer earned a much higher income yield on cost than a new buyer does today.
What About the Balance Sheet?
The balance sheet has shifted materially.
In 2015, ST Engineering held a net cash position of S$252 million with gross debt of about S$1.2 billion.
By the end of FY2025, gross borrowings stood at S$4.8 billion and net debt at S$4.3 billion, reflecting the debt taken on to fund acquisitions — most notably TransCore.
Interest expense jumped from S$49.9 million to S$226 million, though the group’s Aaa/AA+ credit ratings remain intact.
Why Has the Market Valued ST Engineering More Highly?
Market value = earnings × valuation multiple, so growth comes from the business improving, or the market paying more for it.
Both happened, but multiple expansion did the heavy lifting.
The business itself did grow: revenue rose 95.2%, net profit 60.8%, FCF swung to S$1.2 billion, and the order book nearly tripled to S$33.2 billion.
But the market did more of the heavy lifting than the business did – the trailing P/E moved from 19.6x to about 71x on reported earnings (or about 38x on BOP earnings), and EV/EBITDA went from 13.4x to 19.4x.
What Could Drive the Next 10 Years?
Five levers could extend the growth story.
Aerospace expansion (fleet expansion, MRO demand, new capabilities), defence spending (government investment, modernisation, more long-term contracts), and technology (digitalisation, smart city, public safety – still a small slice of earnings) are three.
Strategic acquisitions will further expand geographic reach and cross-selling opportunities.
Above all, converting the S$33.2 billion backlog into profitable delivery remains the most critical lever.
What Could Go Wrong?
Valuation is now the headline risk, given how little of the decade’s gain came from earnings.
Execution risk sits with large contracts and order-book conversion.
Integration risk lies with TransCore’s size and debt it brought.
Aerospace cyclicality, government budgets, and rising costs round out the list.
Get Smart: The Business Behind the Bigger Price Tag
ST Engineering’s rise in value over the past decade is more than a share-price story.
The company has expanded its aerospace, defence and technology businesses, grown its order book, increased earnings and generated more cash while continuing to reward shareholders.
Its transformation helps explain why investors have been willing to place a higher value on the company.
However, historical performance does not guarantee a repeat over the next decade – especially starting from a valuation near 70x P/E that is four times as expensive.
The next decade’s performance will depend on whether ST Engineering can overcome margin compression and convert its massive backlog into real earnings growth and sustainable shareholder returns.
The world’s gotten unpredictable, but some Singapore companies have quietly kept thriving. You’ve probably seen them in your daily life. And yes, they’ve kept paying dividends through it all. Meet 5 resilient stocks built to navigate global storms. Get the free report here and see how they’ve done it.
Follow us on Facebook, Instagram, Telegram and YouTube for the latest investing news and analyses!
Disclosure: Wilson H. does not own shares of any companies mentioned.