The SPDR STI ETF (SGX: ES3), which tracks Singapore’s Straits Times Index (SGX: ^STI), delivered a total return of 24% year to date as of end-August 2026.
Few years match that kind of run.
Yet three SGX-listed small-caps have outpaced the index by wide margins, posting total returns ranging from 33% to 75% over the same period.
Crucially, those figures account for dividends as well as share price appreciation.
The three companies – Union Gas (SGX: 1F2), Micro-Mechanics (SGX: 5DD) and Civmec (SGX: P9D) – each expanded earnings through a distinct driver.
Taken together, they offer useful clues about what the market is rewarding beyond the benchmark blue chips.
What is fuelling Union Gas’s 33.2% return?
Union Gas delivered a 33.2% total return year to date, outpacing the STI by over nine percentage points.
Its first-half 2026 results show why investors took notice.
Revenue jumped 66.4% year on year (YoY) to S$105.9 million, while net profit attributable to shareholders surged 175.8% to S$12 million.
The main driver was the liquid fuel segment, boosted by two new Cnergy service stations at Dunman Road and Queensway.
Revenue from this division surged 444.4% YoY to S$51.7 million on higher sales volumes and initial contributions from both sites.
Gas fuel revenue held flat at S$53.8 million, though segment profit before tax nearly doubled.
Revenue itself almost doubled, yet marketing and distribution costs barely moved.
Free cash flow reached S$25.1 million for the half, up sharply from S$1.3 million a year ago.
As of 30 June 2026, the group held a comfortable net cash position of S$21.7 million.
Management declared an interim dividend of S$0.0048 per share, matching last year’s payout, alongside a maiden special dividend of S$0.0032 per share.
That brought total dividends for the half to S$0.008 per share, up 66.7% YoY.
Looking ahead, two more stations in Marsiling and Jurong West are set to open in 2027, expanding the network to five locations.
The group also acquired two LPG retailers on 31 July 2026 for S$8.2 million to further solidify its footing.
Why did Micro-Mechanics deliver the biggest gain?
Micro-Mechanics returned 75% year to date and outperformed the STI by 51 percentage points.
For the financial year ended 30 June 2026, the precision parts maker reported revenue of S$75.5 million, up 15.8% YoY.
Profit attributable to owners rose 28.3% to S$15.9 million.
Its core consumable tools division generated 80% of total revenue, growing 19.8% to S$60.4 million.
Positive operating leverage and new product developments helped expand gross margins from 49.4% to 51.6%.
China remained the group’s largest market at 34.2% of revenue, with sales expanding 26.6% to S$25.8 million.
Free cash flow came in at S$16.8 million, remaining roughly flat YoY as higher operating cash flow was absorbed by increased capital expenditure.
Balance sheet strength remains a key feature, with net cash standing at S$30.1 million as of 30 June 2026 and no bank borrowings.
The board declared a total dividend of S$0.06 per share for FY2026, maintaining the previous year’s payout.
Investors appear to be pricing in management’s ambitious five-year target to reach at least S$150 million in revenue, which would roughly double its FY2026 top line.
To support this growth, capital expenditure will rise to S$12 million for FY2027 while management maintains a focus on keeping gross margins above 50%, even as it monitors ongoing geopolitical headwinds.
Can Civmec sustain its 45.5% run?
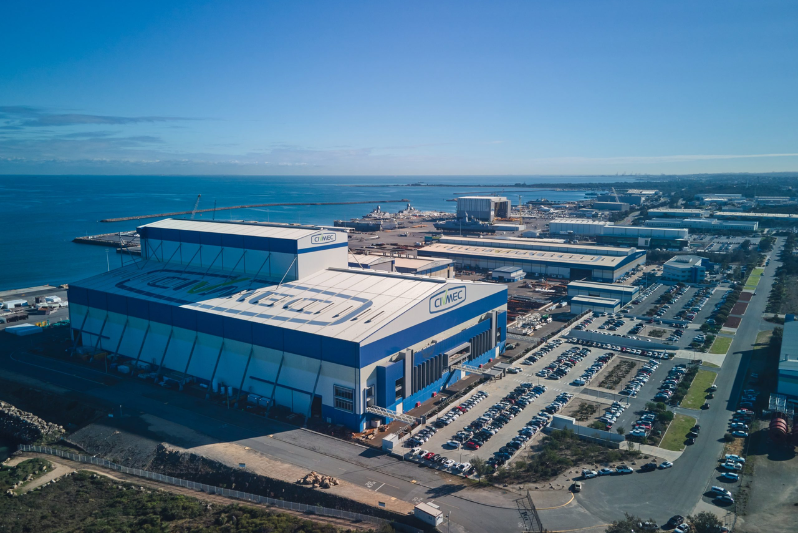
Civmec returned 45.5% year to date, nearly doubling the STI’s performance.
For the financial year ended 30 June 2026, the engineering group reported revenue of A$903 million, up 11.4% YoY.
Net profit attributable to owners rose 22.5% to A$52.1 million.
A major defence transaction transformed its business composition.
Following the acquisition of Luerssen Australia on 1 July 2025, now operating as Civmec Defence Industries, revenue from Infrastructure, Marine & Defence more than doubled to A$210.2 million.
Energy revenue also climbed 62.1% to A$105.7 million, offsetting an 8.4% dip in Resources revenue to A$587.1 million due to lower activity levels.
However, free cash flow swung to negative A$28.5 million, down from positive A$56.1 million a year prior.
Higher operational activity and unbilled work in progress tied up working capital, weighing on cash generation.
As of 30 June 2026, Civmec held A$54.6 million in cash against A$60.0 million in bank borrowings, excluding lease liabilities.
The company declared a total dividend of A$0.06 per share for FY2026, holding steady YoY.
A record order book provides clear revenue visibility heading into FY2027, backed by active tendering across key sectors and an increase in early contractor involvement engagements across multiple locations.
Get Smart: What do these outperformers share?
The market appears to be rewarding companies that pair near-term growth catalysts with clear long-term direction, rather than relying solely on past performance.
Union Gas is actively scaling its retail network, while Micro-Mechanics has laid out a clear roadmap to double revenue over five years.
Both backed their growth momentum with healthy free cash flow – S$25.1 million and S$16.8 million respectively – providing solid backing for their dividend payments.
Civmec presents a slightly different case.
Its strategic defence acquisition doubled a major revenue stream and expanded its order book, but working capital demands pulled free cash flow into negative territory.
The key test for Civmec going forward will be converting its order book back into sustainable cash flow.
Each company now faces a forward question investors cannot skip: can execution last long enough for free cash flow and dividends to keep pace?
Disclosure: Calvina L. does not own shares of any stocks mentioned. Chin Hui Leong contributed to this article and owns shares of Micro-Mechanics.