

The pandemic has left a mark on Singapore’s property conglomerates.
In response, property giants such as CapitaLand Limited (SGX: C31) and Frasers Property Limited (SGX: TQ5), or FPL, have started to reposition themselves for a post-pandemic future.
With both shares sporting a price-to-book ratio of below one, there could be juicy opportunities for investors.
We compare both CapitaLand and FPL on various attributes to see which one stands out against the other.
Financials
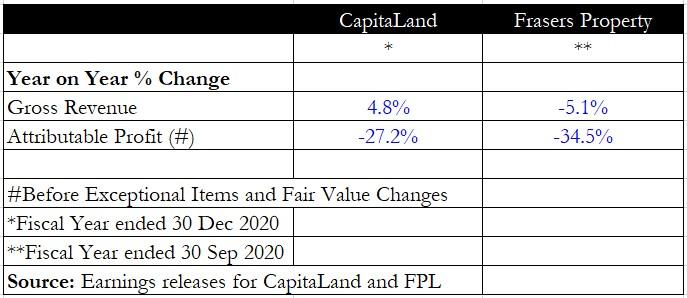
First, we looked at the impact of the downturn on both groups’ revenue and net profit.
To ensure a fair comparison, we used the net profit before fair value changes and exceptional items.
Impressively, CapitaLand managed to grow its gross revenue by 4.8% year on year to S$6.5 billion despite the tough economic conditions.
FPL reported a 5.1% year on year decline in revenue to S$3.6 billion.
For attributable net profit, FPL suffered a steeper fall of 34.5% compared to CapitaLand’s 27.2% year on year decline.
Winner: CapitaLand
Assets under management (AUM)
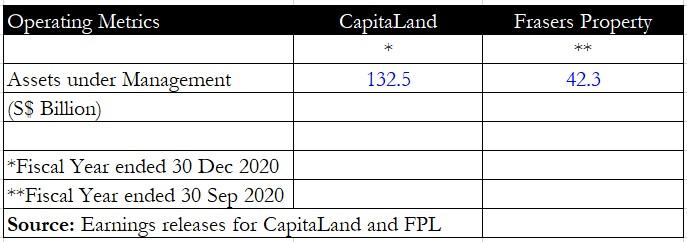
Next, we take a look at the assets under management for each property giant.
CapitaLand is the larger of the two with S$132.5 billion worth of assets with almost three-quarters in both China and Singapore.
FPL has less than half the AUM of CapitaLand at S$42.3 billion with its assets mostly located in Singapore, Australia, Thailand and Vietnam.
Both property giants have the advantage of being diversified across asset classes such as retail, commercial, industrial and hospitality.
Winner: CapitaLand
Debt indicators
Property developers rely on significant amounts of borrowing to fund their operations.
Hence, their debt ratios can indicate whether they may be under financial stress or not
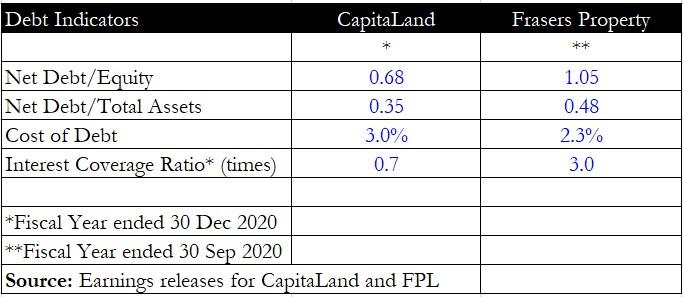
Metrics such as the net debt to total assets and interest coverage ratio are useful in building up a picture of a developer’s financial health.
From the table above, it’s clear that FPL is more highly geared than CapitaLand, with a higher proportion of net debt compared to both its equity and net assets.
However, CapitaLand has a higher cost of debt at 3% while its interest coverage ratio remains low at just 0.7 times.
FPL has a much lower cost of debt at 2.3% and has a better interest cover at three times.
Winner: FPL
Dividends and dividend yield
An income-seeking investor will surely be interested in the dividends aspect of both companies.
First off, we compared the decrease in dividends as the pandemic as both property businesses had to dip into their coffers to prop tenants up with rental reliefs and rebates.
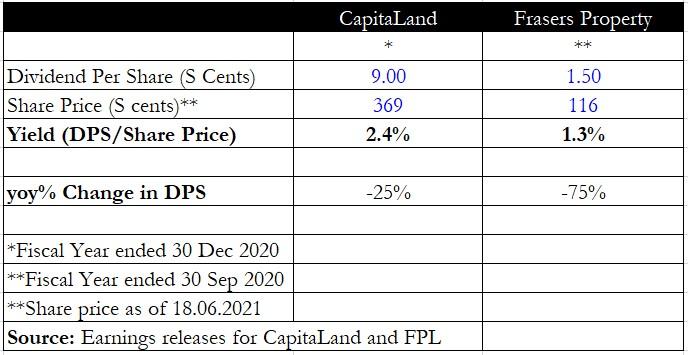
CapitaLand is the clear winner here as its dividend fell by just 25% from S$0.12 to S$0.09.
FPL, however, saw a steep 75% year on year plunge in annual dividends as it declared a S$0.015 dividend, down from the S$0.06 declared a year ago. The company also suspended its interim dividend in light of economic conditions.
Because of the decline in dividends, FPL’s dividend yield has also fallen below that of CapitaLand’s, at 1.3% versus 2.4%.
Winner: CapitaLand
Corporate developments make a difference
Aside from purely looking at numbers and financial metrics, it’s also useful to study recent corporate developments for each company.
FPL conducted a rights issue back in February this year on the basis of 37 rights shares for every 100 shares owned at an issue price of S$1.18 per share.
The rationale for this corporate exercise was to “enhance business resilience” and strengthen the group’s balance sheet.
Without using the proceeds for any major acquisitions, this move will surely dilute FPL’s already weakened earnings per share even further.
CapitaLand, on the other hand, announced a major restructuring where it will spin off its investment management arm and privatise its development arm.
The restructuring is set to unlock value for shareholders once approved in the third quarter of 2021.
Get Smart: CapitaLand seems more appealing
From the above, it seems CapitaLand provides a more compelling option.
Not only does the company have a larger asset base, but it also managed to grow its revenue and did not drop its dividend drastically.
Furthermore, investors can look forward to the impending spin-off of its investment arm under CapitaLand Investment Management or CLIM.
Once CLIM is listed on the stock exchange, it may offer a more attractive investment proposition for investors.
Can’t decide between growth or income? Now, you can enjoy the best of both worlds with our newest FREE report, 8 Singapore Stocks for Your Retirement Portfolio. You’ll discover 8 SGX stocks we believe can offer you strong capital growth and juicy dividend payouts. Click here to download the report.
Follow us on Facebook and Telegram for the latest investing news and analyses!
Disclaimer: Royston Yang does not own shares in any of the companies mentioned.


