The SPDR STI ETF (SGX: ES3), which tracks Singapore’s Straits Times Index (SGX: ^STI), had a bumpy October.
Step back, though, and the fund still delivered a total return of 18.7% for the year to date (YTD).
In fact, a few smaller names did much better.
Micro-Mechanics (Holdings) Ltd (SGX: 5DD) returned 58.1% over the same period, including dividends, while Nanofilm Technologies International Limited (SGX: MZH) and Civmec Limited (SGX: P9D) returned 39% and 36%, respectively.
So what sets these three apart?
Share prices move for many reasons, but their latest results hint at one possible answer.
Profits grew faster than sales, and each company had work lined up.
Investors may be paying up for that combination.
What’s behind Micro-Mechanics’ record quarter?
Micro-Mechanics makes precision tools and parts for semiconductor manufacturing.
For the first quarter of fiscal 2027 (1QFY2027), ended 30 September 2026, revenue rose 45% year on year (YoY) to a record S$24.2 million.
Its Consumable Tools division, which brought in 75.8% of that revenue, helps chipmakers cut defects and improve yields.
Net profit grew even faster, up 102.8% to S$6.4 million, also a quarterly record.
How did profit outrun revenue?
Two words: wider margins.
Gross margin hit a 20-quarter high of 55%, up from 51.5%, while overheads fell to 20.7% of revenue from 25.1%.
Build-to-Print sales rose 97.5% as bookings picked up and material shortages eased.
Management sees strong demand tied to AI, computing and memory chips.
Its five-year plan aims to double revenue from FY2026 levels to at least S$150 million.
The cash flow statement, however, tells a quieter story.
Free cash flow slipped 10.6% YoY to S$3.7 million as trade receivables grew and capital expenditure rose to S$0.9 million from S$0.3 million.
The company plans to spend S$12 million this year on expanding capacity.
It holds S$33.3 million in cash and no bank borrowings.
Micro-Mechanics declared no dividend this quarter, as it pays only in the second and fourth quarters.
Management is watching the Middle East conflict’s effect on costs and supply chains.
How did Nanofilm grow profit 165.6% on 6.1% revenue growth?
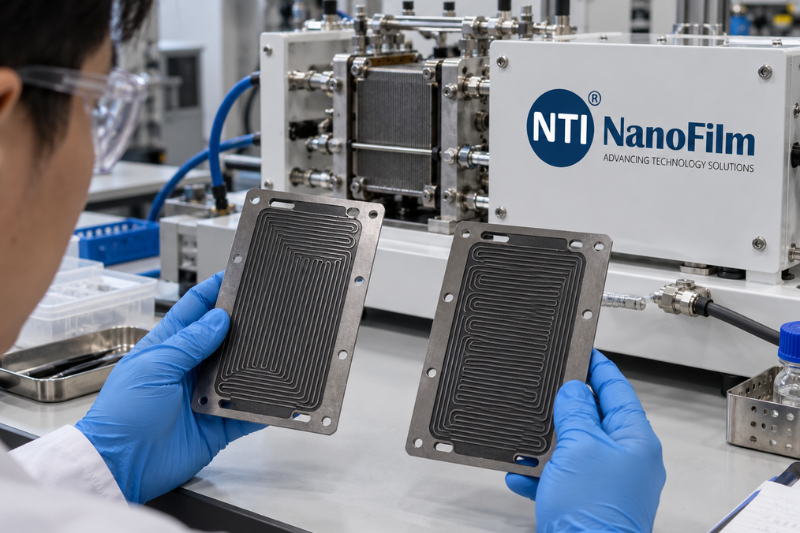
Nanofilm produces advanced material coatings and nanofabricated products.
It reports half-yearly, so its figures cover January to June 2026, earlier than the other two.
In the first half of 2026 (1H2026), revenue rose 6.1% YoY to S$113.7 million.
Profit attributable to equity holders grew 165.6% to S$4.3 million.
Here’s the thing: margins made the difference.
Gross margin widened to 38.6% from 32.6%, which Nanofilm credits to productivity gains, automation and cost discipline.
Those savings more than offset a 56.6% rise in R&D and engineering expenses.
Free cash flow turned positive at S$19.5 million, against negative S$10.3 million a year ago, as receivables collection got better.
Nanofilm also raised its interim dividend to S$0.006 per share, from S$0.003.
As at 30 June 2026, it held S$88.7 million in cash against S$88.8 million in bank loans.
Management expects the Industrial Equipment Business Unit (IEBU) order backlog to support stronger deliveries in 2026’s second half, with visibility into 2027.
On the flip side, the profit growth comes off a small base.
IEBU and Sydrogen (its hydrogen-energy business) revenue fell 28.7% and 43.6% YoY, respectively, on lower equipment sales and project delays.
Tighter memory chip supply and rising component prices may keep pressure on costs.
Can Civmec’s order book sustain the momentum?
Headquartered in Henderson, Western Australia, Civmec provides heavy engineering, construction, maintenance and naval shipbuilding services.
For 1QFY2027, ended 30 September 2026, revenue rose 70.2% YoY to a record A$324 million.
Net profit after tax grew 75.2% to A$18.4 million, and net profit margin improved to 5.7% from 5.5%.
Its construction division drove the growth as major projects ramped up, including BHP’s Port Debottlenecking Project 2 and Iluka Resources’ Eneabba Rare Earths Refinery.
As at 29 October 2026, Civmec’s order book stood at around A$1.4 billion, up from A$1.15 billion a year ago.
On 5 October 2026, it announced more than A$220 million in new contract awards and extensions for delivery across FY2027 and FY2028.
It pays dividends half-yearly.
Its FY2026 dividends totalled A$0.060, including a final A$0.035 paid on 23 October 2026.
There are gaps, though.
The quarterly update had no cash flow statement or balance sheet, so investors cannot see free cash flow or debt.
A 5.7% net margin also leaves little room for cost overruns, and management gave no guidance for FY2027.
Get Smart: Is the cash keeping up with the profits?
When profits grow faster than sales, a business keeps more of each dollar it earns.
Dividend investors should ask one more question: is the cash following?
Micro-Mechanics doubled its profit, yet free cash flow fell.
Nanofilm is the opposite, with free cash flow well above profit.
So when a stock beats the index, don’t stop at the profit line.
Compare free cash flow with net profit over several periods.
Then ask whether the margin gains came from lasting changes or from conditions that may fade.
A stock that beat the STI this year still needs cash to keep rewarding you.
S$5 billion in government backing. S$1.1 billion already deployed. Singapore’s small-cap market is about to explode, and most people are completely clueless. Our FREE report gives you the inside track on 5 companies positioned to benefit. Download now before the crowd catches on.
Follow us on Facebook, Instagram, Telegram and YouTube for the latest investing news and analyses!
Disclosure: Calvina L. does not own any shares in any of the companies mentioned. Chin Hui Leong contributed to the article and owns shares in Micro-Mechanics.