Singapore real estate investment trusts (S-REITs) must distribute at least 90% of their taxable income to unitholders to qualify for tax transparency.
This makes them very popular amongst income investors.
But how do you read and analyse a REIT’s financial results?
Results announcements can run to dozens of pages.
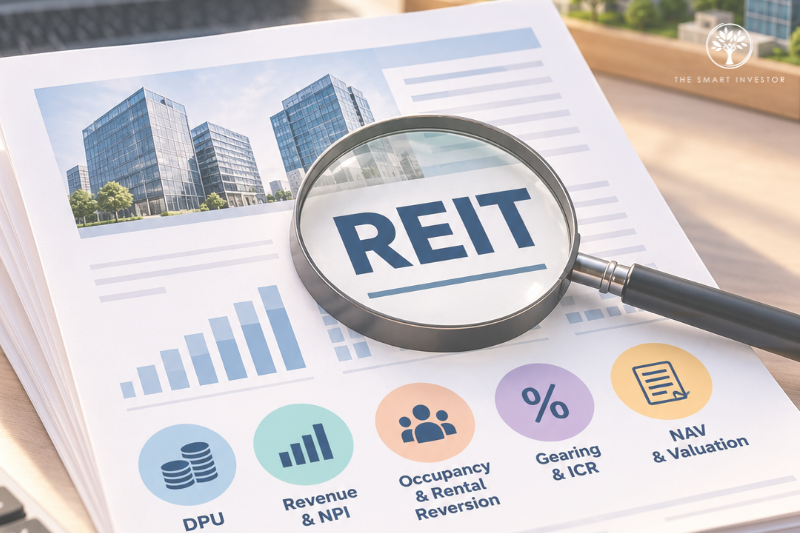
Here’s a five-minute checklist covering the five key metrics that matter most.
1. Check Distribution Per Unit
Distribution per unit (DPU) is the most direct measure of the cash income a REIT pays out to its unitholders.
You can compare the latest DPU with the same period a year ago to determine whether it is growing, stable or declining.
A falling or cut DPU is often a red flag pointing to rising financing costs, negative rental reversions or loss of major tenants.
It is also important to know if a REIT’s DPU increase comes from recurring income or one-off items.
Parkway Life REIT (SGX: C2PU), or PLife REIT, for example, paid a DPU of S$0.0877 for 1H2026, up 14.6% from S$0.0765 in 1H2025.
For PLife REIT, gross revenue dipped 1.6% year on year (YoY).
Even so, DPU grew, thanks to higher rental from its Singapore hospitals and nursing homes in France, as well as the absence of a one-off tax provision that had weighed on 1H2025.
In other words, part of the 14.6% jump came from a weaker comparison base, not stronger recurring income.
2. Examine Gross Revenue and Net Property Income (NPI)
Gross revenue refers to the total income generated by a REIT’s properties, while net property income (NPI) is the income remaining after deducting property operating expenses.
Assess whether rental income growth comes from organic growth, such as higher rental rates or acquisitions of additional properties.
This helps determine whether the REIT is improving its existing properties’ performance or simply expanding its portfolio.
CapitaLand Integrated Commercial Trust (SGX: C38U), or CICT, reported a 10% YoY increase in revenue in the first nine months of 2026, but the increase came largely from acquisitions such as Paragon, partly offset by properties it sold.
Watch operating expenses too.
If gross revenue grows 5% but NPI grows only 2%, costs are rising faster than rental income.
This is why NPI growth is often a better indicator of underlying property performance, as it reflects the REIT’s ability to generate rental income and manage operating costs effectively.
3. Look at Portfolio Occupancy and Rental Reversion
Portfolio occupancy measures the proportion of a REIT’s total lettable space that is leased.
A high REIT occupancy rate supports stable and recurring rental income.
Declining occupancy may indicate weaker demand or difficulty securing tenants.
Compare the latest occupancy rate with the previous quarter’s to identify whether leasing performance is improving.
CICT, Singapore’s largest REIT, reported committed occupancy of 96.1% for 3Q2026, up from 95.6% in 2Q2026.
The June figure excluded space being renovated at Tampines Mall, while the September figure included it, as that work had been completed.
Investors should also monitor upcoming lease expiries, as major vacancies could affect future rental income.
Rental reversion refers to the change in rental rates when existing leases are renewed or replaced.
Positive rental reversion suggests strong leasing demand and potential rental income growth.
4. Check Gearing and Interest Coverage
A REIT’s gearing ratio measures its borrowings relative to its total assets, indicating how much debt it uses to finance its properties.
Excessive debt increases financial risk, particularly when interest rates rise or property values decline.
Compare the REIT’s aggregate leverage against Singapore’s prevailing regulatory limit of 50%.
Look at the interest coverage ratio (ICR), which measures the REIT’s ability to meet its borrowing costs.
A higher ICR indicates stronger financial flexibility, as the REIT earns several times what it needs to cover its interest bill.
Singapore’s rules require REITs to keep their ICR at a minimum of 1.5 times.
As at 30 June 2026, PLife REIT’s gearing was 33.8% with an ICR of 8.2 times.
CICT’s gearing was 39.7% with an ICR of 3.8 times as at 30 September 2026.
Both are comfortably within the limits, though PLife REIT has more room to absorb higher interest costs.
Investors should also assess how much debt is due for refinancing over the next 12 to 24 months and the proportion of fixed-interest-rate borrowings.
Both show how exposed DPU is to rising interest rates, even when rental income is healthy.
5. Review Net Asset Value and Valuation
Net asset value (NAV) per unit represents the value of a REIT’s total assets after deducting its liabilities, divided by the number of units outstanding.
Changes in property valuations, asset acquisitions and borrowings can all affect NAV per unit.
Investors should compare the REIT’s unit price with its NAV per unit using the price-to-book (P/B) ratio (unit price divided by NAV per unit).
A ratio below 1 indicates that the REIT is trading at a discount to its reported NAV, while a ratio above 1 indicates a premium.
However, trading at a discount does not automatically mean the REIT is undervalued.
It could simply reflect concerns about asset quality, debt levels or future performance.
A REIT’s distribution yield (annual DPU divided by unit price) can reveal whether it’s paying out a generous cash return, but a high yield often acts as a warning sign that the market is doubting the safety of those payouts.
Investors should assess whether distributions are sustainable based on earnings and cash flow.
Get Smart: Five Minutes Can Reveal a Lot
Reading REITs’ financial results becomes much easier when you know which numbers to focus on.
DPU reveals the income you receive, revenue and NPI show how the underlying properties are performing, and occupancy and rental reversions offer clues on future rental income.
Gearing and ICR help you assess financial risks, and NAV and valuation aid in deciding if the current unit price is attractive.
Rather than reacting to headlines about a DPU rise or cut, understand what is driving it.
Ultimately, knowing how to read REIT results can help you identify whether a REIT deserves a spot in your portfolio.
When the market is unpredictable, where can you park your money with confidence? Our latest FREE report reveals 5 Singapore dividend-payers built to withstand global storms. Get it now and see what’s still worth holding.
Follow us on Facebook, Instagram, Telegram and YouTube for the latest investing news and analyses!
Disclosure: Wenting A. does not own units in any of the REITs mentioned.