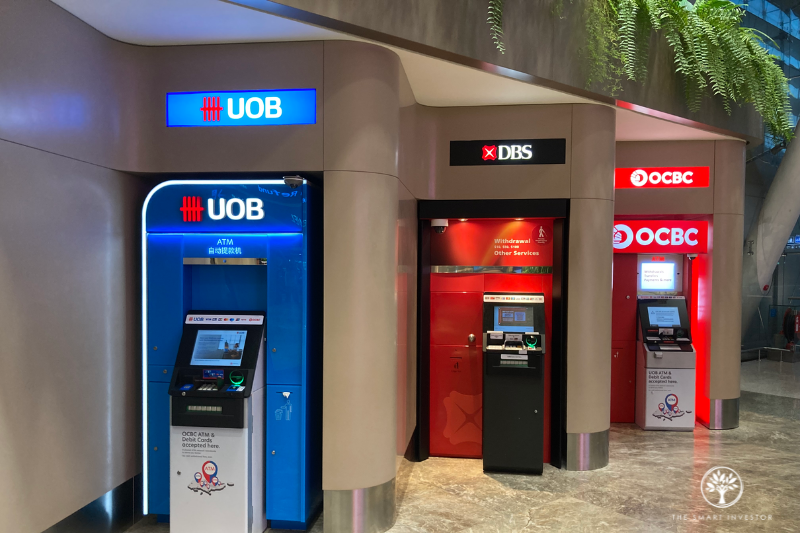
Singapore banks enjoyed a stellar run in their share prices last year.
DBS Group (SGX: D05) led the pack with a 43.9% surge while United Overseas Bank (SGX: U11), or UOB, and OCBC Ltd (SGX: O39) came in close to each other with share price gains of 27.7% and 28.4%, respectively.
The impressive share price gains were not without good reason.
All three banks reported record profits for 2024 and also upped their dividends along the way.
Investors may find it tough to filter out which bank to buy as the trio reported solid results.
Let’s break down each component of the banks’ earnings and financial metrics to see which bank qualifies as the best buy.
Note: UOB only disclosed its second half of 2024 (2H 2024) metrics while both DBS and OCBC disclosed quarterly metrics.
Financials

Source: Banks’ 2024 earnings reports
Let’s start with each bank’s financials, or more specifically, its income and profits.
DBS is the standout winner here with a double-digit, 10.5% year-on-year increase in its total income.
The strong result was because of a 5% year-on-year improvement in DBS’s net interest income to S$15 billion.
For OCBC, the year-on-year increase in its NII was just 1% while UOB saw flat NII for 2024.
All three banks, however, posted healthy year-on-year growth in their fee income.
In terms of net profit, DBS saw the highest year-on-year increase of the three banks at 12.2%.
Winner: DBS
Net interest margins (NIMs) and loan books

Source: Banks’ 2024 earnings reports
Next, we move on to each bank’s NIM, which is a measure of the spread between a bank’s deposit rate and its lending rate.
In short, a larger NIM means that the bank is earning a wider spread, which in turn benefits its NII.
We also take a look at whether each bank managed to grow its loan book.
OCBC has the highest NIM of the three banks at 2.2% for 2024, and its NIM also equalled DBS for 4Q 2024 at 2.15%.
However, DBS saw the gentlest year-on-year decline in its NIM at just 0.02 percentage points (ppt) for 2024, compared to UOB’s 0.06 ppt and OCBC’s 0.08 ppt.
OCBC also saw a sharp year-on-year fall in its 4Q 2024 NIM of 0.14 ppt.
As for loan growth, OCBC registered the highest loan growth at 7.6% year on year while DBS saw the smallest at just 3.5%.
Combining all the facts, OCBC still comes out ahead with the highest NIM for 2024 and the best year-on-year loan growth.
Winner: OCBC
Cost-to-income ratio (CIR)

Source: Banks’ 2024 earnings reports
The next metric we look at is each bank’s cost-to-income ratio (CIR).
A lower CIR implies that the bank is more efficient in controlling its expenses.
Here, OCBC is the winner as well with the lowest CIR for both 4Q 2024 and 2024.
Winner: OCBC
Return on equity (ROE)

Source: Banks’ 2024 earnings reports
Return on equity, or ROE, is arguably one of the more important financial metrics used to assess the profitability of a bank.
DBS had the highest ROE of the trio by far at 18% for both 2023 and 2024, with UOB and OCBC sharing an ROE of 13.7% for 2024.
Even for both 3Q 2024 and 4Q 2024, DBS demonstrated that it had the strongest ROE among the three banks.
Winner: DBS
Non-performing loans (NPL) ratio

Source: Banks’ 2024 earnings reports
Next up, we have the non-performing loans (NPL) ratio which measures the proportion of a bank’s loan book that is expected to turn sour.
The lower this ratio is, the better, as it means that the bank’s loan book is of high-quality with a lower risk of defaults.
OCBC takes the cake here with an NPL ratio that dipped below 1% for 2024.
OCBC has also maintained its NPL ratio from 3Q 2024 to 4Q 2024, unlike DBS which saw its NPL ratio worsen slightly from 1% to 1.1%.
Winner: OCBC
Dividend yield

Source: Banks’ 2024 presentation slides
Income investors should sit up when it comes to this next metric – dividend yield.
All three banks upped their final and total dividends for 2024 in light of their strong results.
The table above shows that OCBC had the highest dividend yield of the three at 5.9% but this only tells part of the story.
All three banks declared some sort of special dividend to pay out their excess capital.
The table above does NOT include the special dividend for DBS and UOB as DBS declared a “capital return dividend” of S$0.15 per share per quarter while UOB declared a special dividend of S$0.50 to be paid out in two tranches.
Therefore, if you include this additional dividend, DBS will pay out a total of S$3 for 2025, giving it a forward dividend yield of 6.5%.
UOB’s forward dividend yield will increase to 6% if the S$0.50 additional dividend is included.
Hence, DBS will have the highest dividend yield of the three if we include the additional dividends.
Winner: DBS
Valuation

Source: Banks’ 2024 earnings reports
Finally, we look at how expensive each bank’s shares are in light of last year’s surge.
UOB is now the cheapest of the three banks with a price-to-book (P/B) ratio of 1.23 times.
DBS is the most expensive of the trio with its P/B ratio at close to two times.
Winner: UOB
Get Smart: Valuation or dividends
DBS and OCBC both tick off the most number of boxes as we survey each bank’s financials and operating metrics.
Investors need to decide if they prefer to buy a cheaper bank or one that has a higher forward dividend yield.
Another factor working in DBS’s favour is that it pays its dividends quarterly, unlike UOB or OCBC which pay half-yearly dividends.
Want to pave your child’s road to being a millionaire? Start today so they shield their money from pricey hawker meals and sky-high HDB costs. The first step is to set aside money to invest in dividend stocks. The second step is to grab a copy of our latest FREE report. Inside, we show you the secrets to investing for your children, including 3 SGX stocks to consider today for a wealthier future. Click HERE to download a copy now.
Follow us on Facebook and Telegram for the latest investing news and analyses!
Disclosure: Royston Yang owns shares of DBS Group.