

Income-seeking investors continue to favour REITs as reliable sources of dividends.
What’s more, REITs can also allow investors to enjoy diversification as the properties may span different property sub-classes and regions.
On this note, we decided to take a closer look at two REITs managed by sponsor Frasers Property Limited (SGX: TQ5).
They are Frasers Centrepoint Trust (SGX: J69U), or FCT, and Frasers Logistics & Commercial Trust (SGX: BUOU), or FLCT.
FCT’s portfolio comprises suburban retail malls located in Singapore while FLCT’s portfolio contains mainly logistics and commercial properties spread out across several countries.
We size up each REIT to see which makes a more attractive investment option.
Portfolio composition
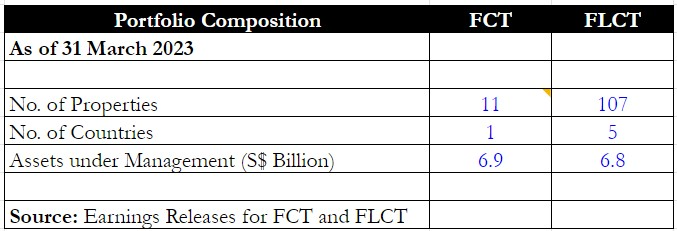
First off, we look at the portfolio composition for each REIT.
FCT is a pure-play Singapore retail REIT with 10 retail properties along with an office building.
Examples of these malls include Century Square, Hougang Mall and Tiong Bahru Plaza which are frequented by heartlanders living in HDB flats.
FLCT, on the other hand, has a more international portfolio of 107 properties spread out across five countries.
Therefore, FLCT’s portfolio is much more diversified compared with FCT even though both REITs sport roughly the same value in assets under management.
Winner: FLCT
Financials
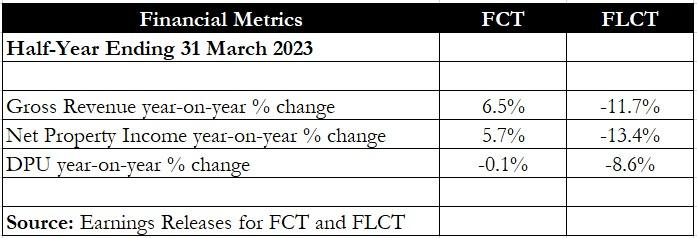
Moving on to the financials, FCT saw a 6.5% year on year increase in gross revenue while net property income (NPI) improved by 5.7% year on year for its fiscal 2023’s first half (1H FY2023).
DPU remained flat year on year at S$0.0613.
The retail REIT benefitted from the continued recovery in consumer spending.
CEO of the manager for FCT also saw an increasing trend of consumers prioritising spending on essential goods, which will help the REIT’s malls to enjoy higher footfall and tenant sales.
FLCT, on the other hand, saw revenue and NPI tumble year on year because of the absence of Cross Street Exchange, which was divested on 31 March 2022.
The strong Singapore dollar also proved to be a headwind for the logistics cum commercial REIT as the depreciation of the underlying currencies such as the Australian Dollar, Euro and British Pound took their toll.
As a result, FLCT’s DPU fell by 8.6% year on year to S$0.0352.
Winner: FCT
Debt metrics
When it comes to debt, there is a world of difference between the two REITs.
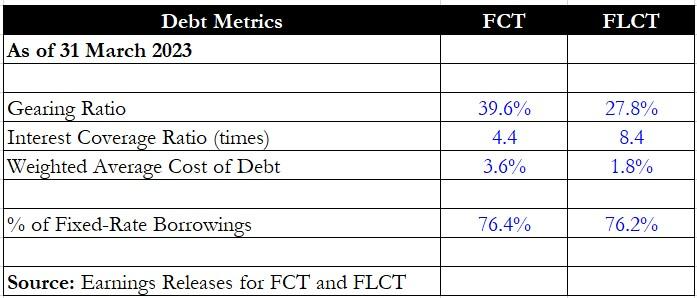
FLCT’s gearing was almost 12 percentage points lower than FCT, coming in at 27.8% versus 39.6%.
Granted, FCT’s higher gearing was because the REIT undertook two acquisitions in quick succession – the first was an additional 10% stake in Waterway Point while the second was a 25.5% stake in NEX mall in Serangoon.
FLCT did not engage in any acquisitions since June last year when it entered into a forward-funding opportunity in the UK.
Meanwhile, FCT’s weighted average cost of debt was also double that of FLCT.
There could be a further rise in FCT’s cost of debt as 17.7% of its debt is maturing in fiscal 2023 (FY2023), compared to just 3.9% for FLCT.
Both REITs have roughly the same level of fixed rate borrowings, but FLCT has quantified the impact of a continued rise in rates which FCT did not.
Every 0.5 percentage point increase in interest rates will cause a S$0.0006 decline in DPU, or around 0.9% of the annualised DPU for 1H FY2023.
Winner: FLCT
Operating metrics
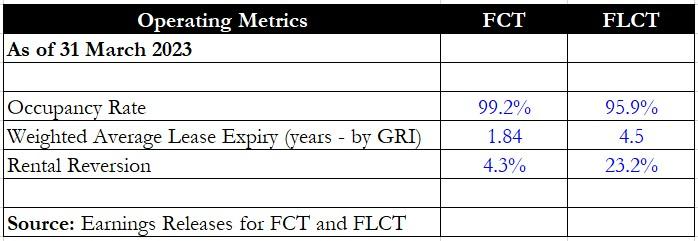
Looking at the REITs’ operating metrics, FCT boasts a higher occupancy rate compared with FLCT.
However, on an absolute basis, both REITs have occupancy levels above 95% which is at a sufficiently high level.
FLCT’s WALE is more than twice as long as FCT’s as the latter’s leases are shorter by nature because of its retail tenants.
Rental reversion-wise, FLCT’s 23.2% is significantly higher than FCT’s 4.3% and provides further organic rental growth upside for the REIT.
Winner: FLCT
Distribution yield
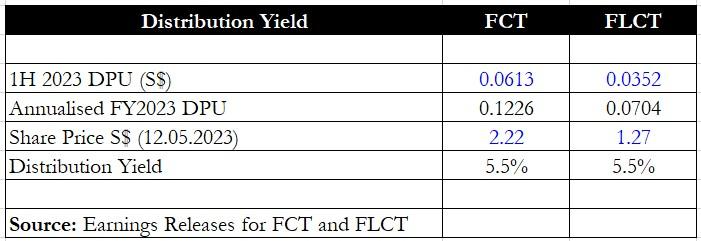
We took the liberty of annualising each REIT’s latest 1H FY2023 DPU to get an idea of the annualised DPU and distribution yields.
It turns out that both REITs sport the same distribution yield of 5.5% after we did this exercise.
Winner: It is a draw!
Get Smart: Consider the future
On both debt and operating metrics, FLCT is the clear winner.
However, it’s good to consider each REIT holistically.
For FCT, it has conducted two acquisitions that should show up as higher rental income and NPI in future periods.
There is also an asset enhancement initiative ongoing at Tampines 1 Mall which should deliver a return on equity of roughly 8%.
FCT’s suburban malls should also see consistent footfall and tenant sales helped by the recovery in tourism activity and boosted by the need for essentials.
FLCT may sport a lower gearing level but the REIT has not conducted any accretive acquisition in nearly a year.
The REIT also last conducted a divestment back in October 2022 and has not engaged in any capital recycling activities for nearly nine months.
Moreover, its CEO is also undergoing a transition, with Mr Robert Wallace stepping down and extending his appointment cessation to 1 August 2023.
The manager of FLCT is actively recruiting for his successor and will announce this in due course.
Did you know there are 5 REIT sectors with a high potential for creating passive income? If you are building retirement wealth, this is crucial information. We have a new report that details all you need to know about them. Find out which sector to pay attention to, and see if you can fit them into your portfolio. Click HERE to download the guide here for free.
Follow us on Facebook and Telegram for the latest investing news and analyses!
Disclosure: Royston Yang owns shares of Frasers Logistics & Commercial Trust.


